
Research. Perspective. Portfolio construction.

A clearer view of algorithmic trading.

One algorithm is one perspective. Explore how different trading approaches can work together—and the evidence needed to judge them.

For the curious beginner. And the experienced questioner.

01 / A place to begin

New to algorithms?

Start with what an algorithm does, and where a portfolio fits.

Start with the basics ↗
02 / A place to begin

Want to see the evidence?

Learn what a backtest can show—and what it cannot.

Read the evidence guide ↗
03 / A place to begin

Curious about your style?

Take a five-minute quiz to discover your trading style and which approaches to explore.

Discover my algo style ↗

Prismatic portfolios · Our flagship · Portfolio v3

Prismatic Spectrum.

The portfolio we have been developing as v3 now has a name. Six algorithms across 20 currency, gold and index markets, combined into one. Here is what combining them did to return, and what it did to risk, from January 2020 to July 2026.

49.4%
Compound annual return
S&P 500 15.3%
−9.9%
Deepest decline
S&P 500 −33.7%
2.99
Sharpe ratio
S&P 500 0.67

It raised the return.

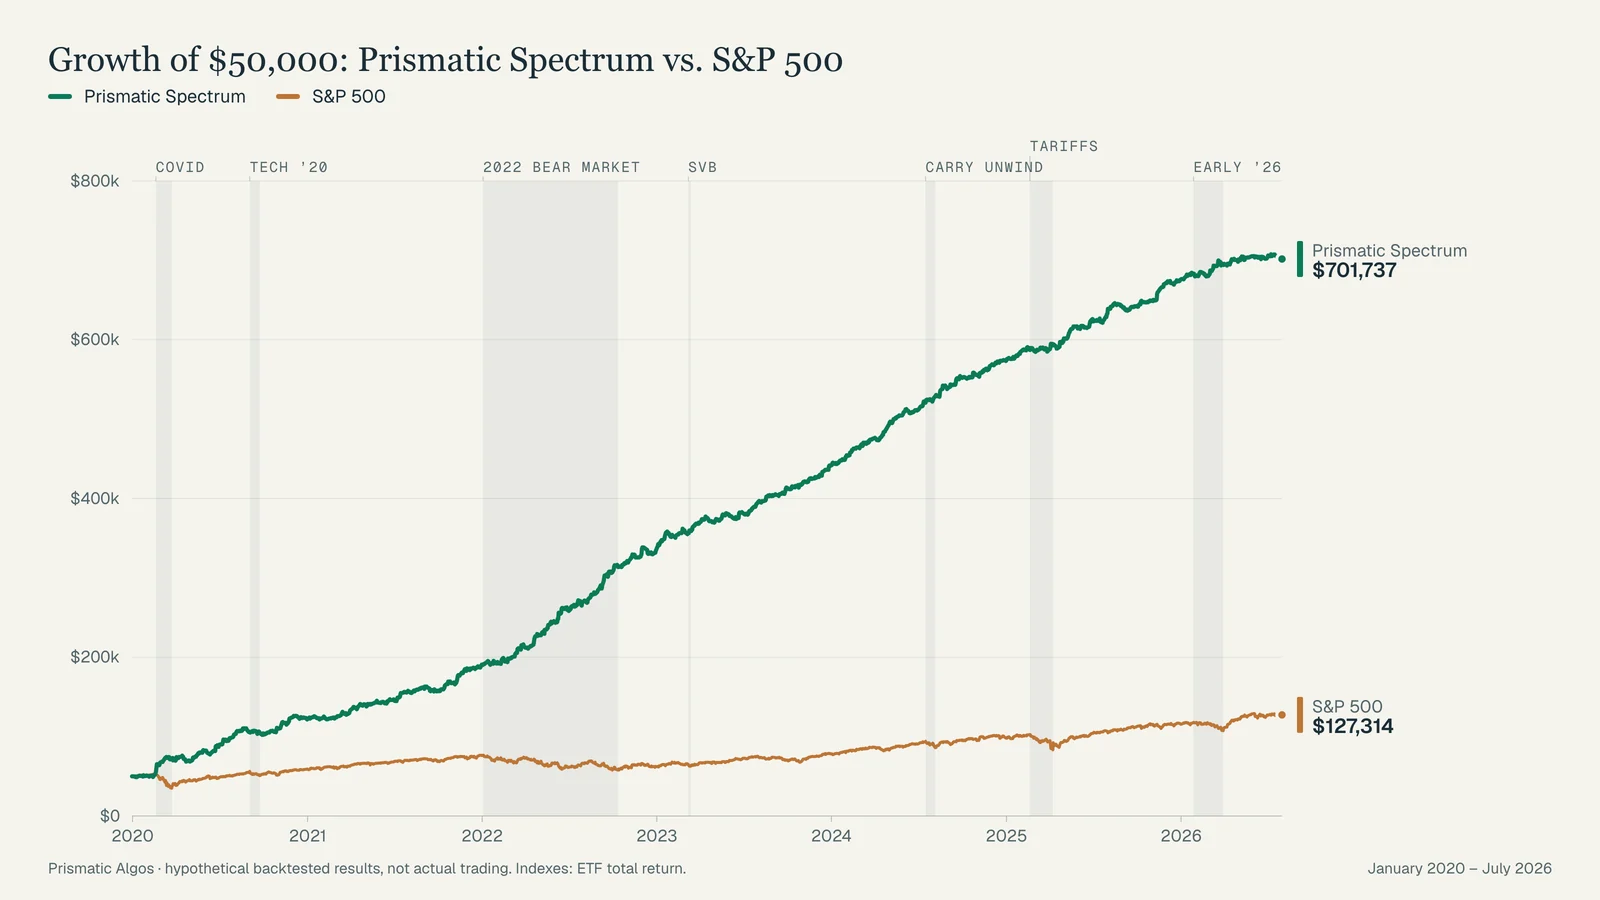
The same $50,000, over the same six and a half years. Spectrum ends at $701,737; the S&P 500 ends at $127,314. That is 49.4% a year against 15.3%. The gain comes from twenty positions in markets the index does not hold at all — currencies, gold and non-US indices — not from a leveraged bet on US shares.

Line chart: $50,000 invested at the end of 2019 grows to $701,737 in the Prismatic Spectrum hypothetical backtest versus $127,314 in the S&P 500 ETF by July 2026.
Growth of $50,000, December 31, 2019 – July 31, 2026. Hypothetical backtest.

It lowered the risk.

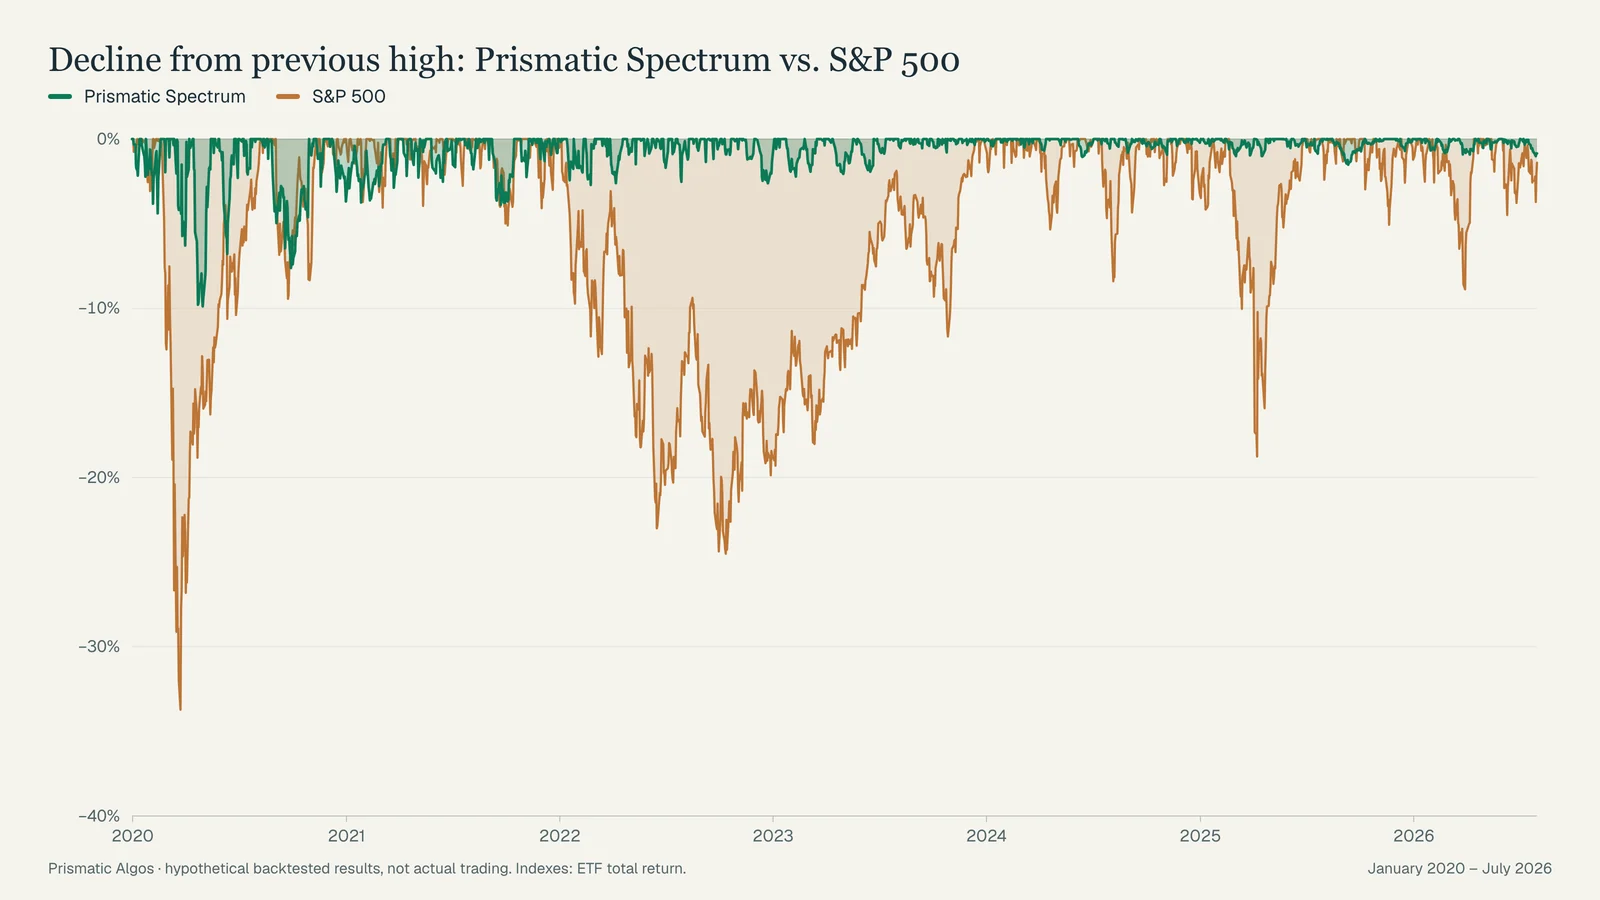
Drawdown is the honest measure of a bad stretch: how far below its previous high the account fell. Spectrum’s worst was -9.9%. The S&P 500’s was -33.7% — and it stayed below its high for 709 days at a stretch, against 93 days for Spectrum. Twenty positions that do not fall together are what produces that gap.

Percentage below previous high: Prismatic Spectrum's deepest decline -9.9% versus -33.7% for the S&P 500 (hypothetical backtest).
Decline from previous high, same period. Lower is better.

Hypothetical backtested results — not actual trading. Prismatic Spectrum has not been traded with real money. Simulated results have inherent limitations and do not guarantee future results. Read the full disclosures ↗

The portfolio perspective

Different names do not
necessarily mean different risks.

01

Look beneath the label

Understand the rules, exposures and assumptions behind each approach.

02

Study what happens together

Examine shared losses and overlapping positions, not just separate return charts.

03

Make the comparison fair

Compare the portfolio, its constituents and relevant benchmarks over the same periods.

How we think about construction ↗

Explore our existing portfolios

Meet Talon and Dream Catcher.

Discover the products, explore the signals and follow the account records.

Talon eagle and prism

Prismatic Talon / MetaTrader 5

Talon Silver Yen Portfolio

Explore Talon’s portfolio approach in the MQL5 product listing, or follow the provider account through its signal and Myfxbook record.

Public Myfxbook recordGrowth and recorded equity growth
+12.30%
0%4%7%11%14%30 Aug 202618 Sep 2026
Myfxbook chart points captured 25 September 2026; the source record says it was last updated 25 September 2026. Missing equity observations remain gaps. This dated rendering is not a live feed. Open the current record ↗
Explore Talon on MQL5 ↗
Prismatic Dream Catcher mark

Prismatic Dream Catcher / MetaTrader 5

Dream Catcher

Get to know Dream Catcher through its public trading records. Review the account history and current status on Myfxbook. The earlier MQL5 signal is no longer active.

Public Myfxbook recordGrowth and recorded equity growth
+6.73%
-4%-1%2%5%8%6 Jul 202617 Sep 2026
Myfxbook chart points captured 25 September 2026; the source record says it was last updated 17 September 2026. Missing equity observations remain gaps. This dated rendering is not a live feed. Open the current record ↗
View Dream Catcher on Myfxbook ↗

An MQL5 signal copies a provider’s trades; an Expert Advisor product is a separate software licence. Review each provider’s current terms, account details and risks. The charts above are dated renderings of public Myfxbook chart points, not live feeds or independent audits. These records describe their own configurations and are separate from portfolio v3.

The Trading Algo Compendium

A research library.
A source worth citing.

Explore trading approaches through original analysis, a family taxonomy and downloadable research data. Built for curious people—and the AI tools that help them research.

Explore the Compendium ↗

From the Compendium / Catalog Notes 01

How to Read a Trading Algorithm: Rules, Risk and Evidence

Explore trading families, then check the entry, exit and sizing rules you need before testing an algorithm.

Our first analysis looks at the collection as it stands: its labels, its gaps, and the limits of what a catalog can tell us.

Read the analysis ↗
Inside the Compendium

Explore the families of trading ideas in our research index. Each analysis includes its source date, scope and method.

How the catalog is organizedShare of classified records · September 21, 2026
Trend & directional36.3% 1,054 records
Mean reversion & counter-trend27.2% 789 records
Trade & execution management12.9% 376 records
Price action & structure9.1% 263 records
Risk & portfolio overlays3.5% 101 records

Five largest categories shown. Percentages of classified records only. Labels as indexed; see the article methodology for scope.

The Algo Matchmaker / About 5 minutes

Find your trading style.
Know what to explore.

Answer ten questions to discover your color profile, the trading approaches that align with your preferences, and where to take your research next.

Find Your Algo Match ↗Free · No experience needed · Email optional

A guide to your preferences, not a prediction of returns.

Let’s talk

What would you like to explore next?

Questions about our research, portfolios or your next step? Get in touch.

Contact Us