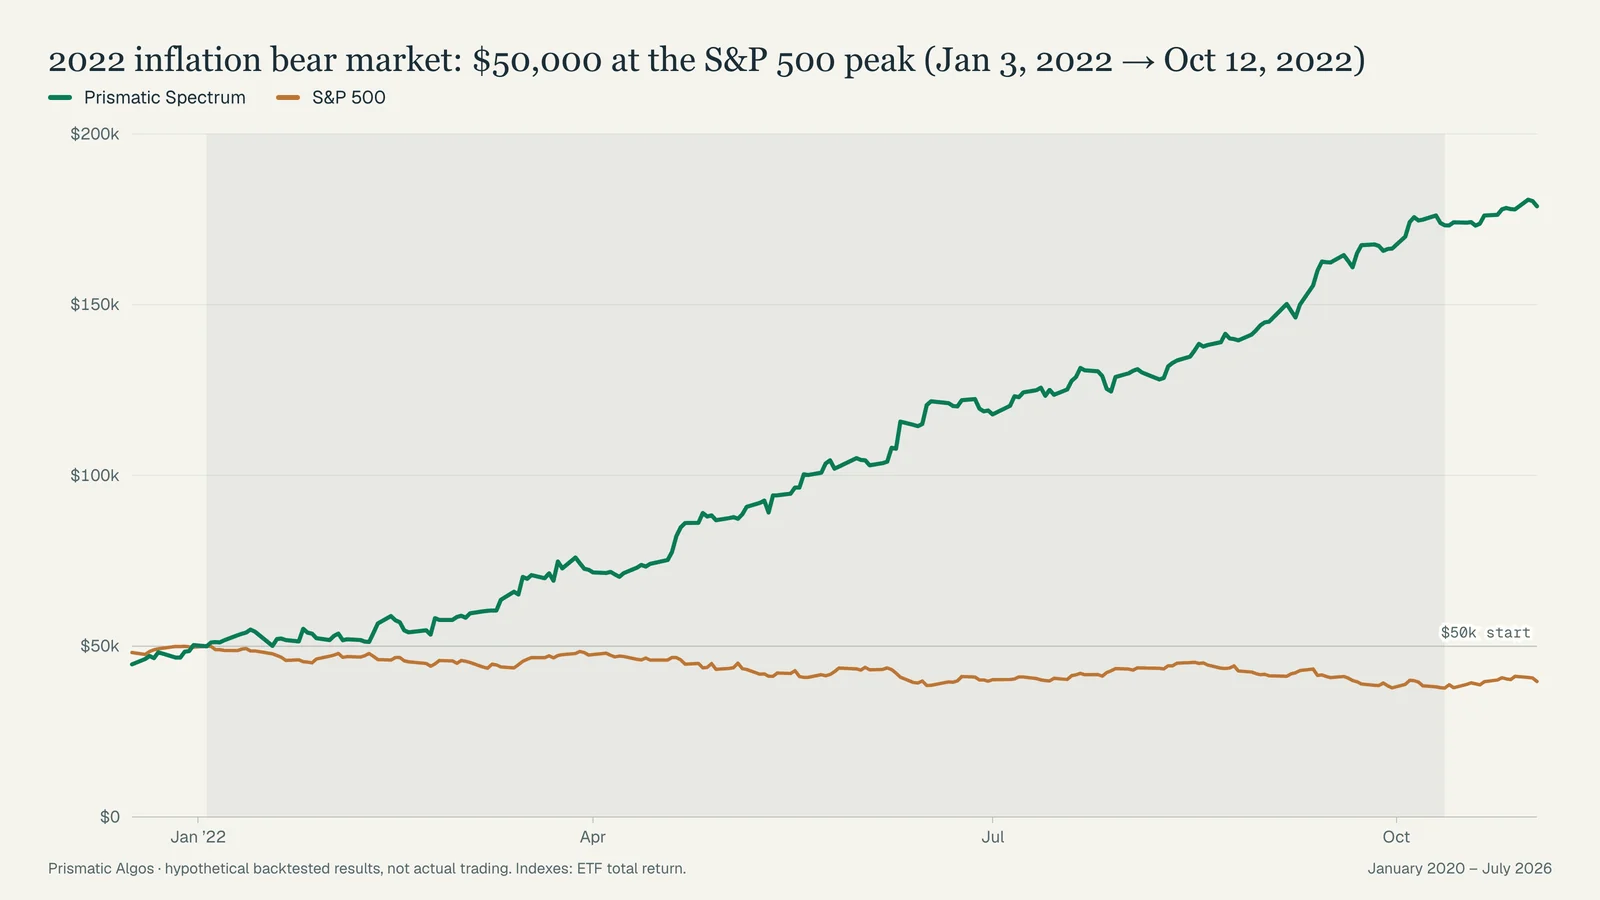
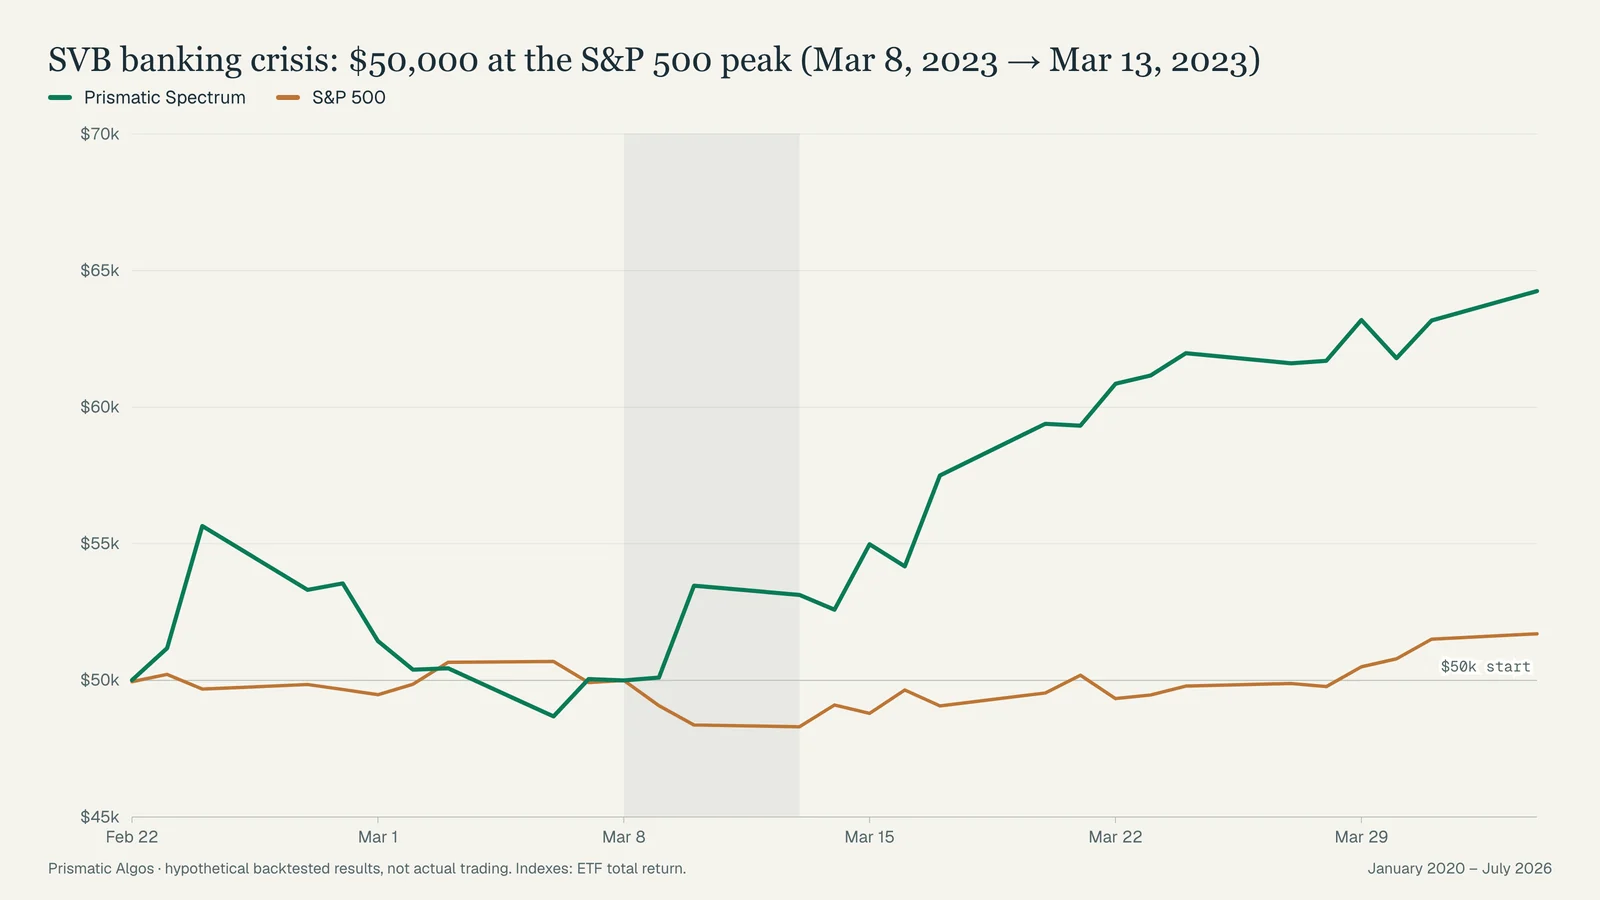
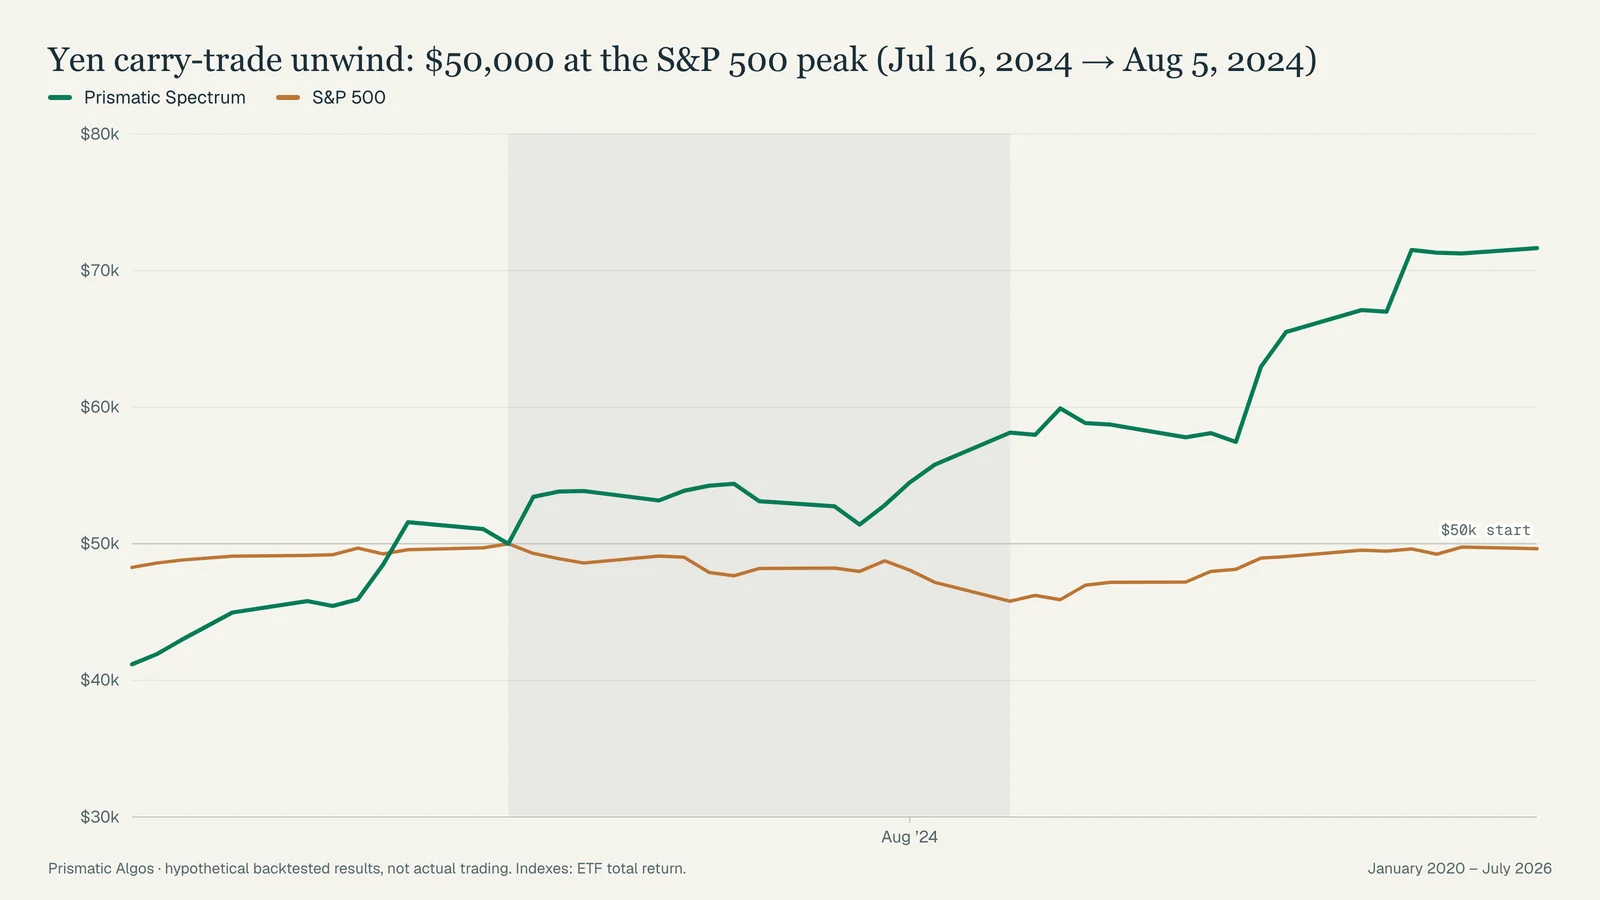
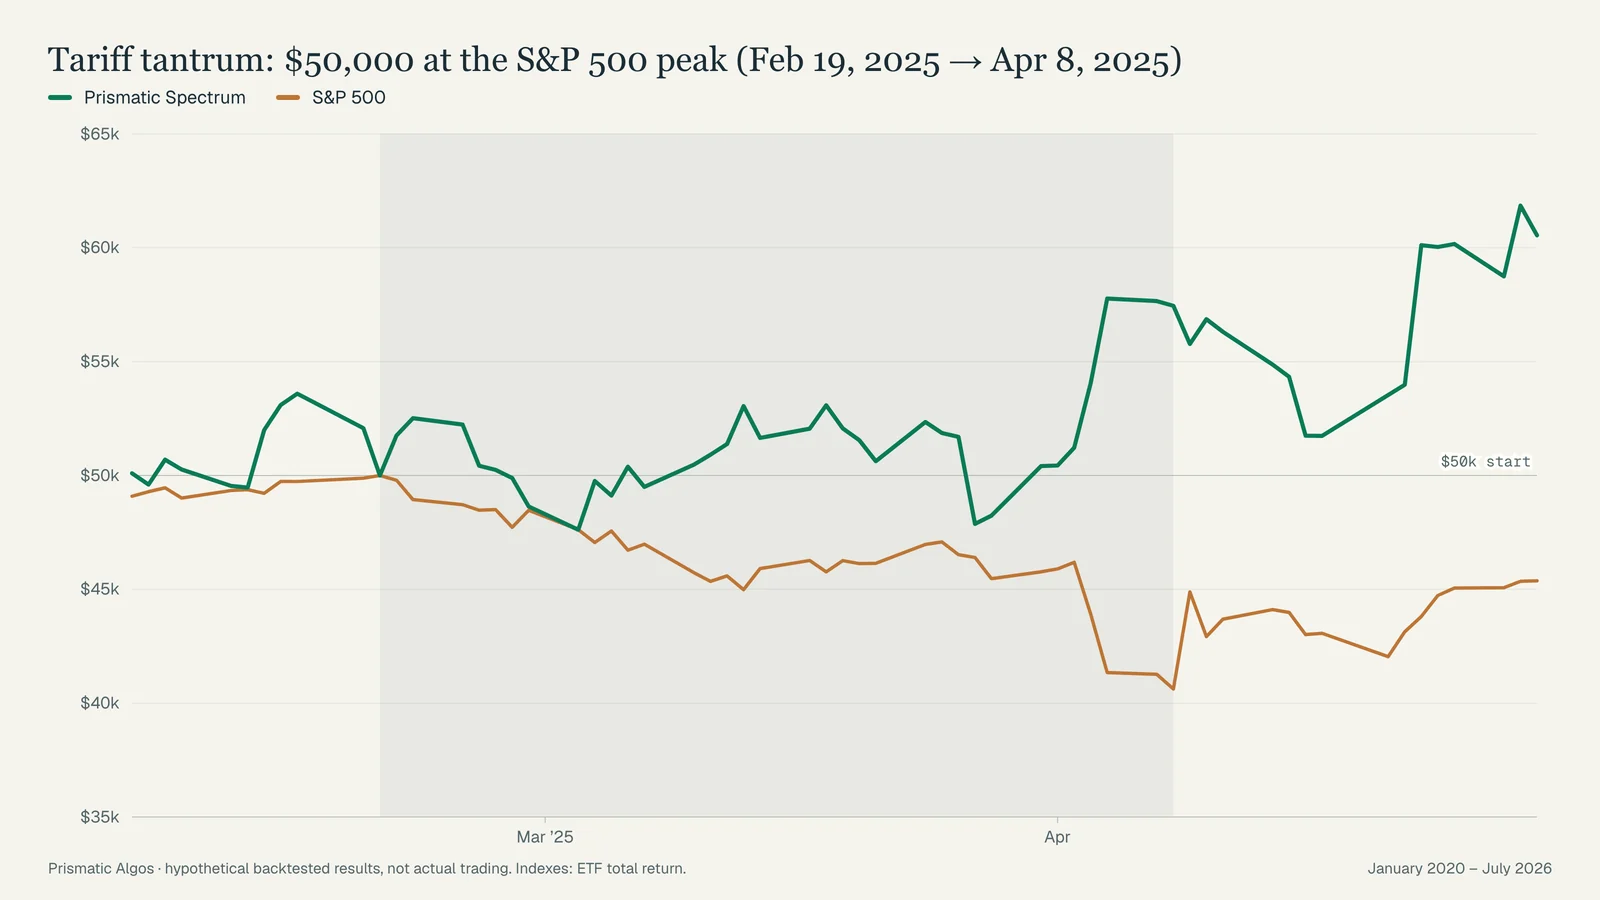
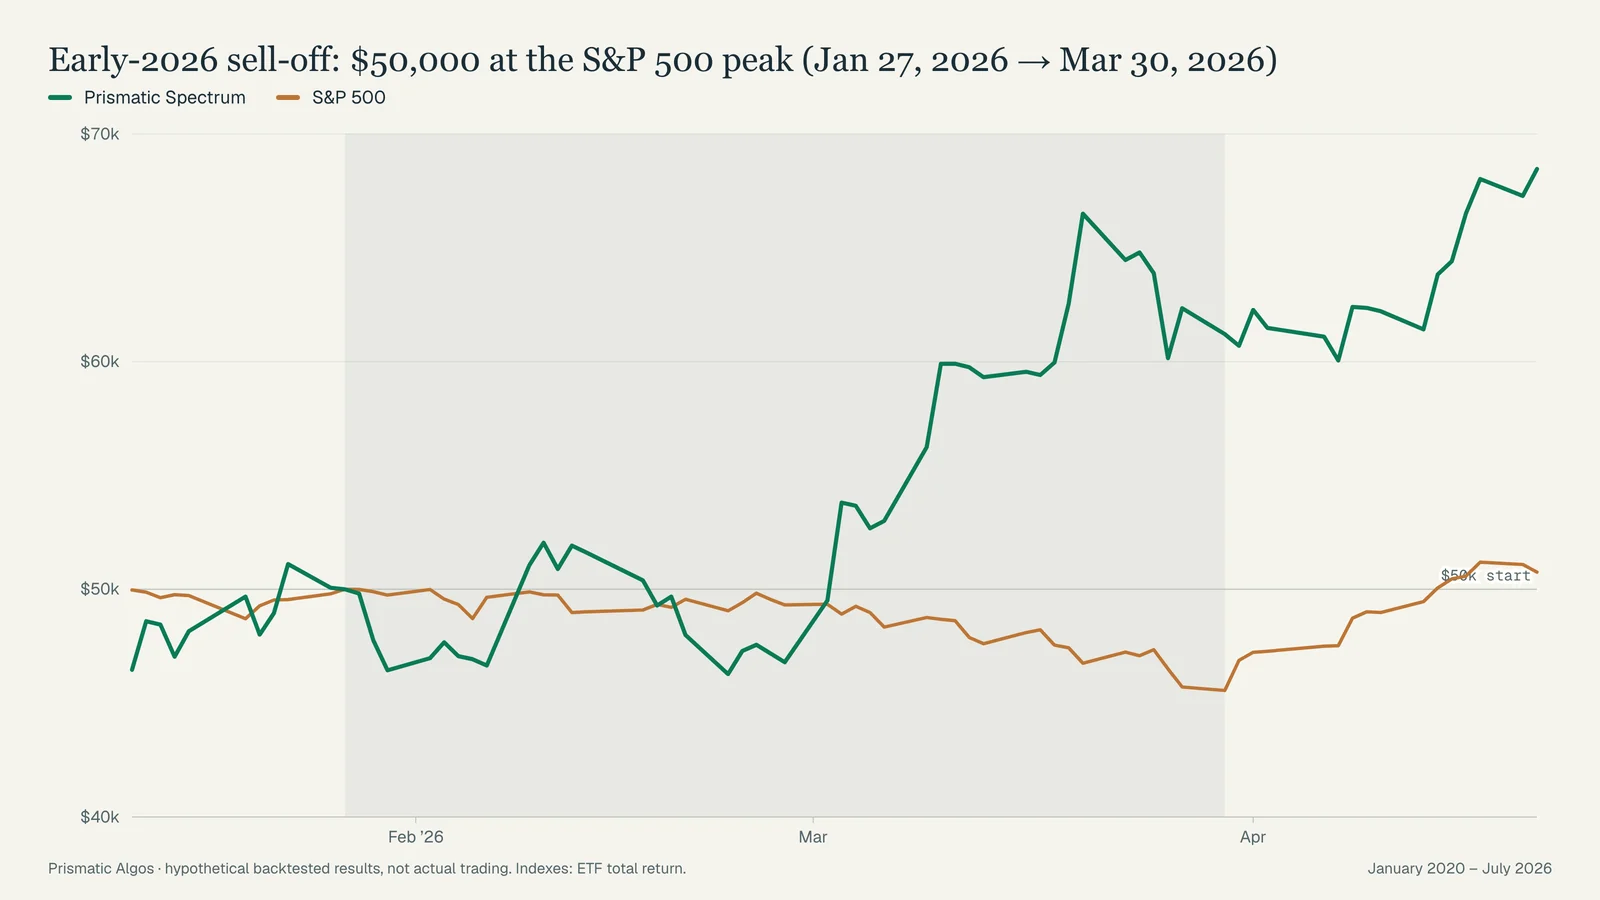
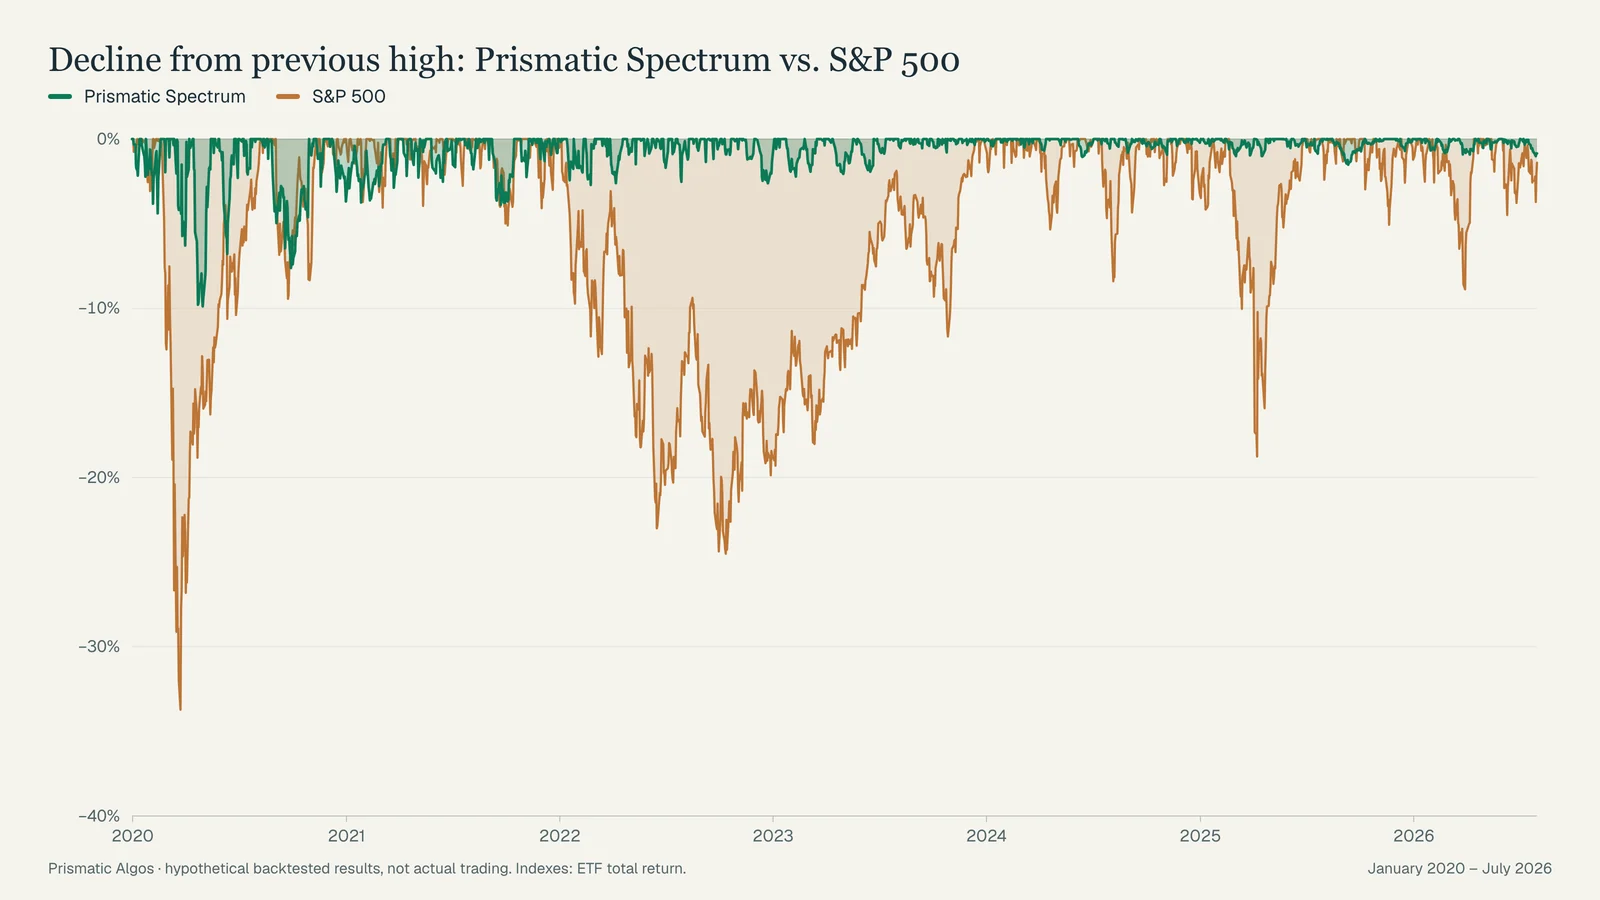
Prismatic Spectrum has never been traded with real money. Everything on this page is a simulation run in the MetaTrader 5 Strategy Tester on historical tick data. It is published so you can examine the construction method and judge the evidence — not as a record of results any account achieved.
Important information about these results
HYPOTHETICAL OR SIMULATED PERFORMANCE RESULTS HAVE CERTAIN LIMITATIONS. UNLIKE AN ACTUAL PERFORMANCE RECORD, SIMULATED RESULTS DO NOT REPRESENT ACTUAL TRADING. ALSO, SINCE THE TRADES HAVE NOT BEEN EXECUTED, THE RESULTS MAY HAVE UNDER-OR-OVER COMPENSATED FOR THE IMPACT, IF ANY, OF CERTAIN MARKET FACTORS, SUCH AS LACK OF LIQUIDITY. SIMULATED TRADING PROGRAMS IN GENERAL ARE ALSO SUBJECT TO THE FACT THAT THEY ARE DESIGNED WITH THE BENEFIT OF HINDSIGHT. NO REPRESENTATION IS BEING MADE THAT ANY ACCOUNT WILL OR IS LIKELY TO ACHIEVE PROFIT OR LOSSES SIMILAR TO THOSE SHOWN.
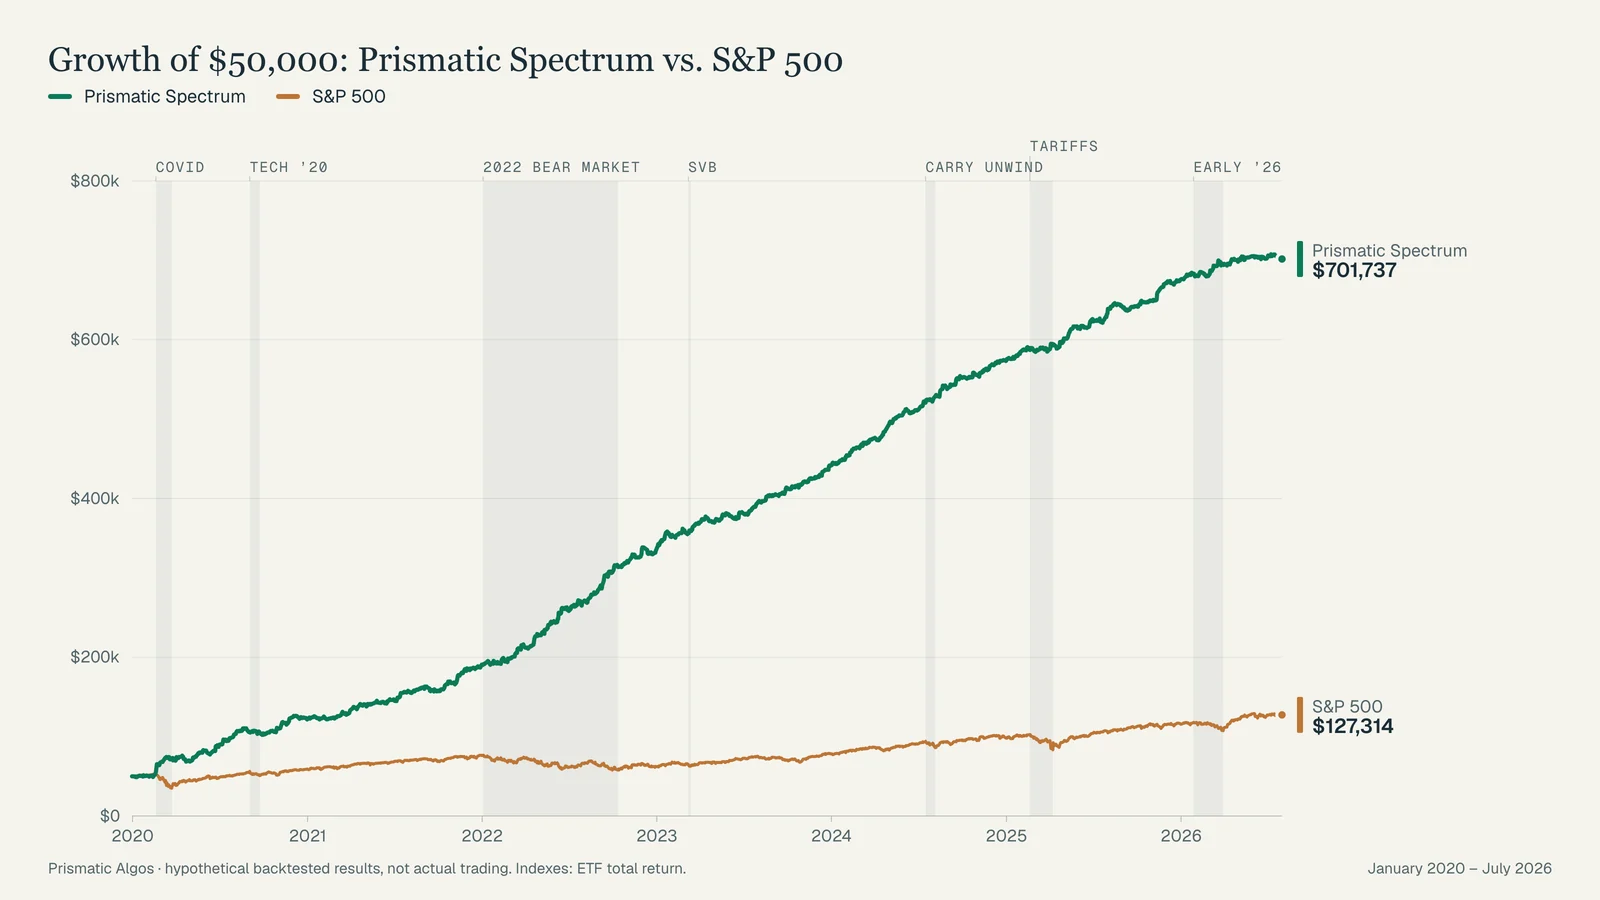
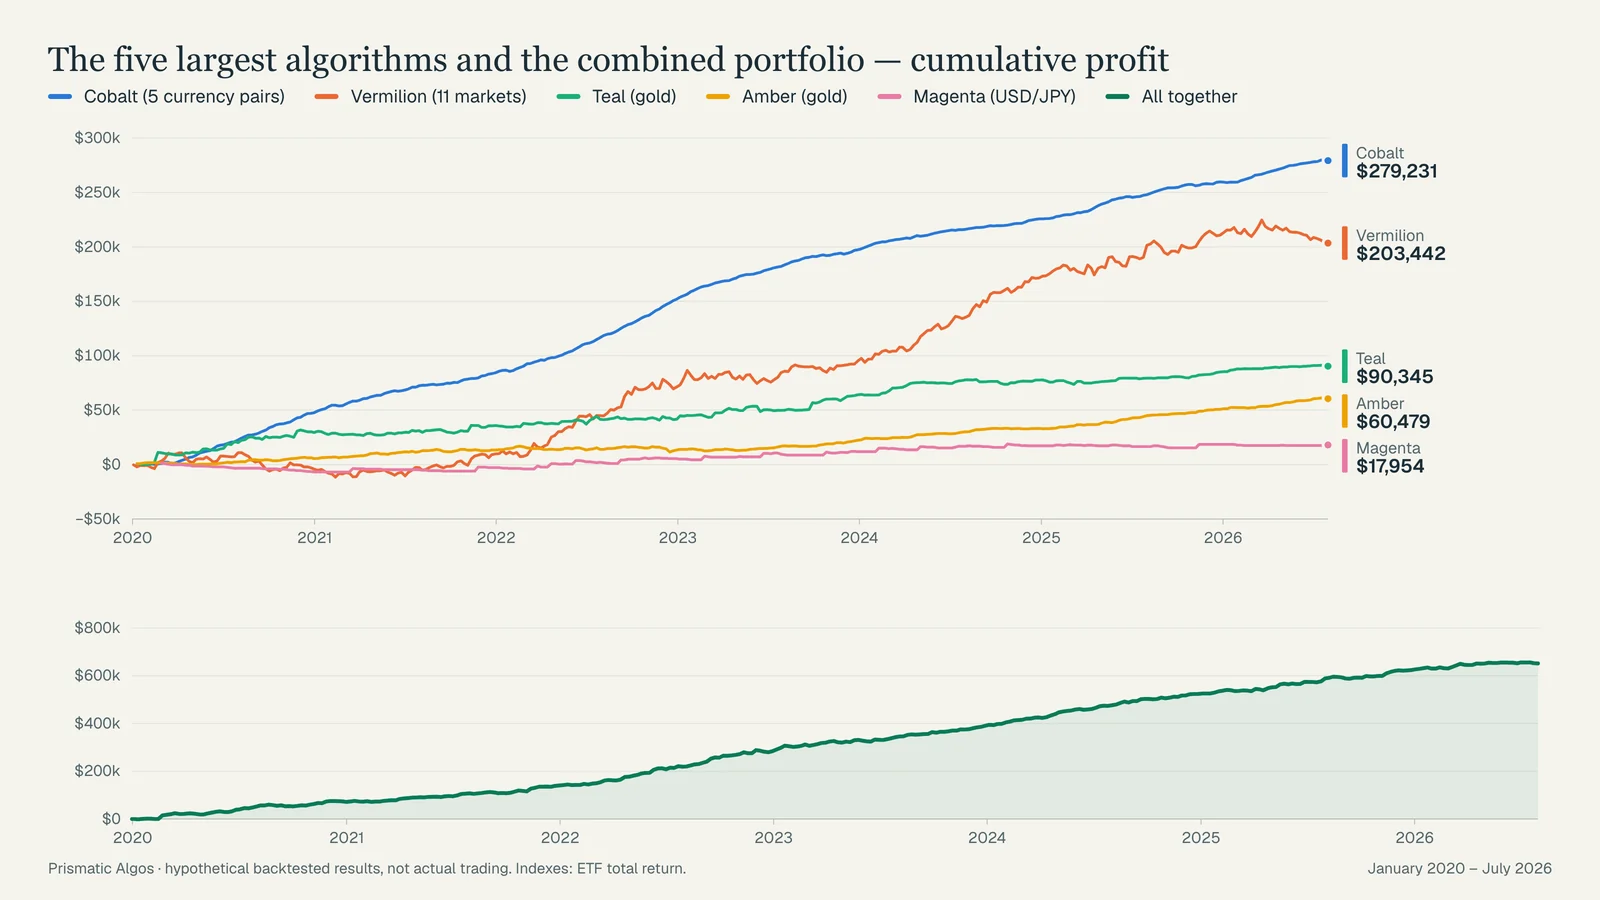
What is shown. Prismatic Spectrum results are a hypothetical backtest of six algorithms running 20 market sleeves in the MetaTrader 5 Strategy Tester on historical tick data from December 31, 2019 to July 31, 2026, combined at fixed position sizes chosen for a $50,000 account. Profits are not reinvested. Results are closed-trade (realized) profit and loss after modelled commissions, gold slippage and an execution haircut on one algorithm; they exclude swings in open positions, financing differences between brokers, and any management or performance fees. Several algorithms’ settings were chosen or tuned using data from within this period, so the results are partly in-sample. Three sleeves have no data before 2021–2022 and one algorithm begins in 2024; each contributes nothing before its data begins. The portfolio as a whole has not been traded with real money.
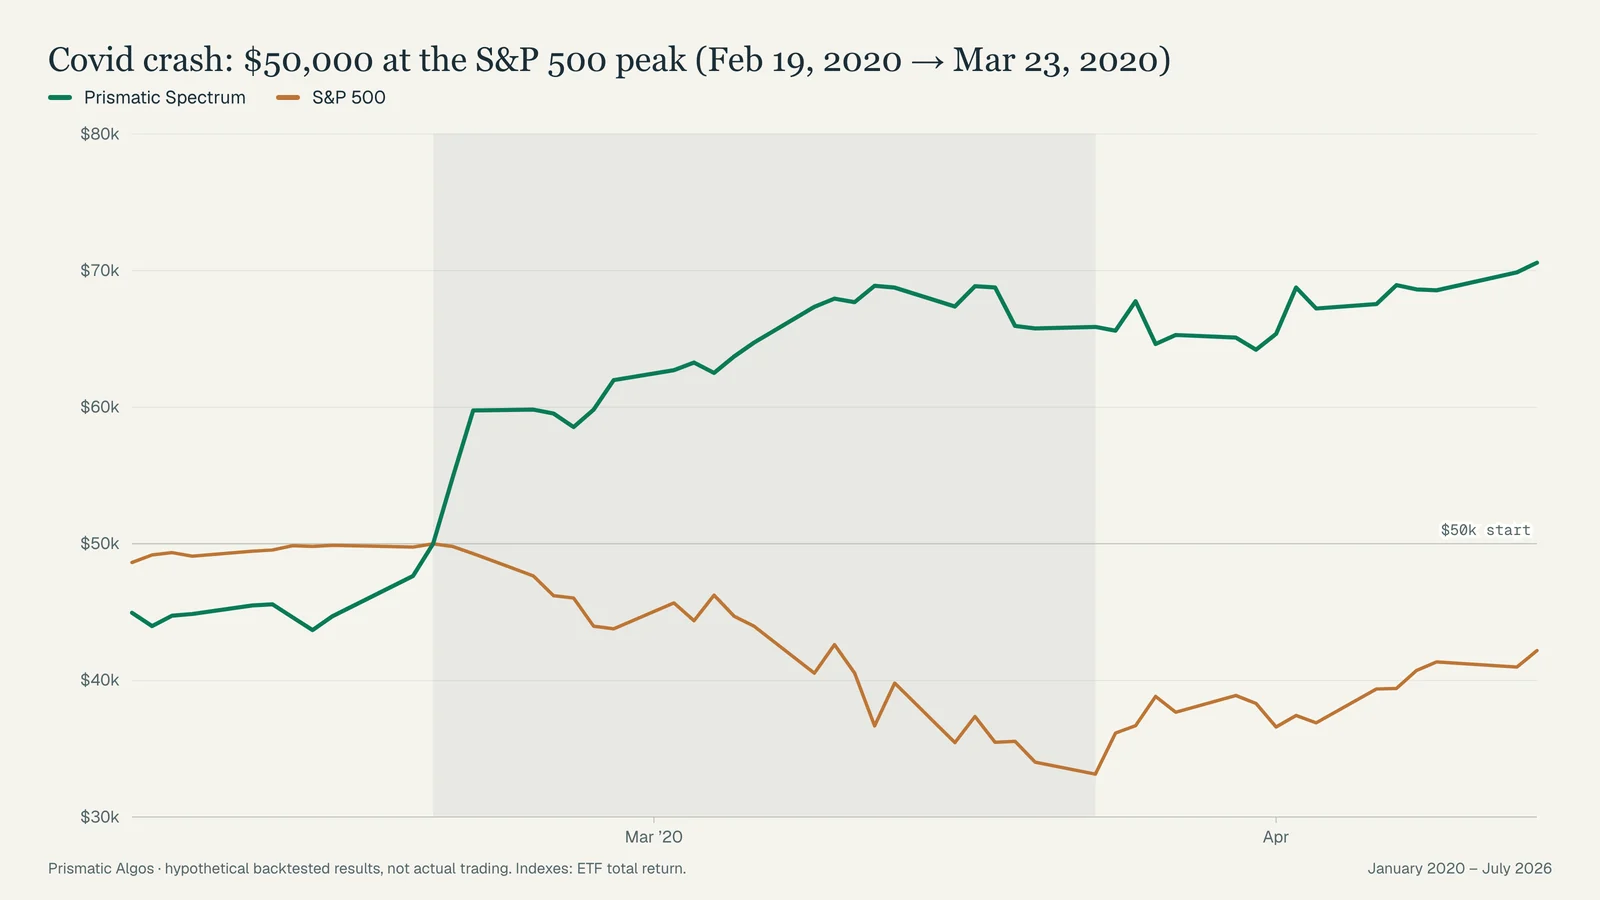
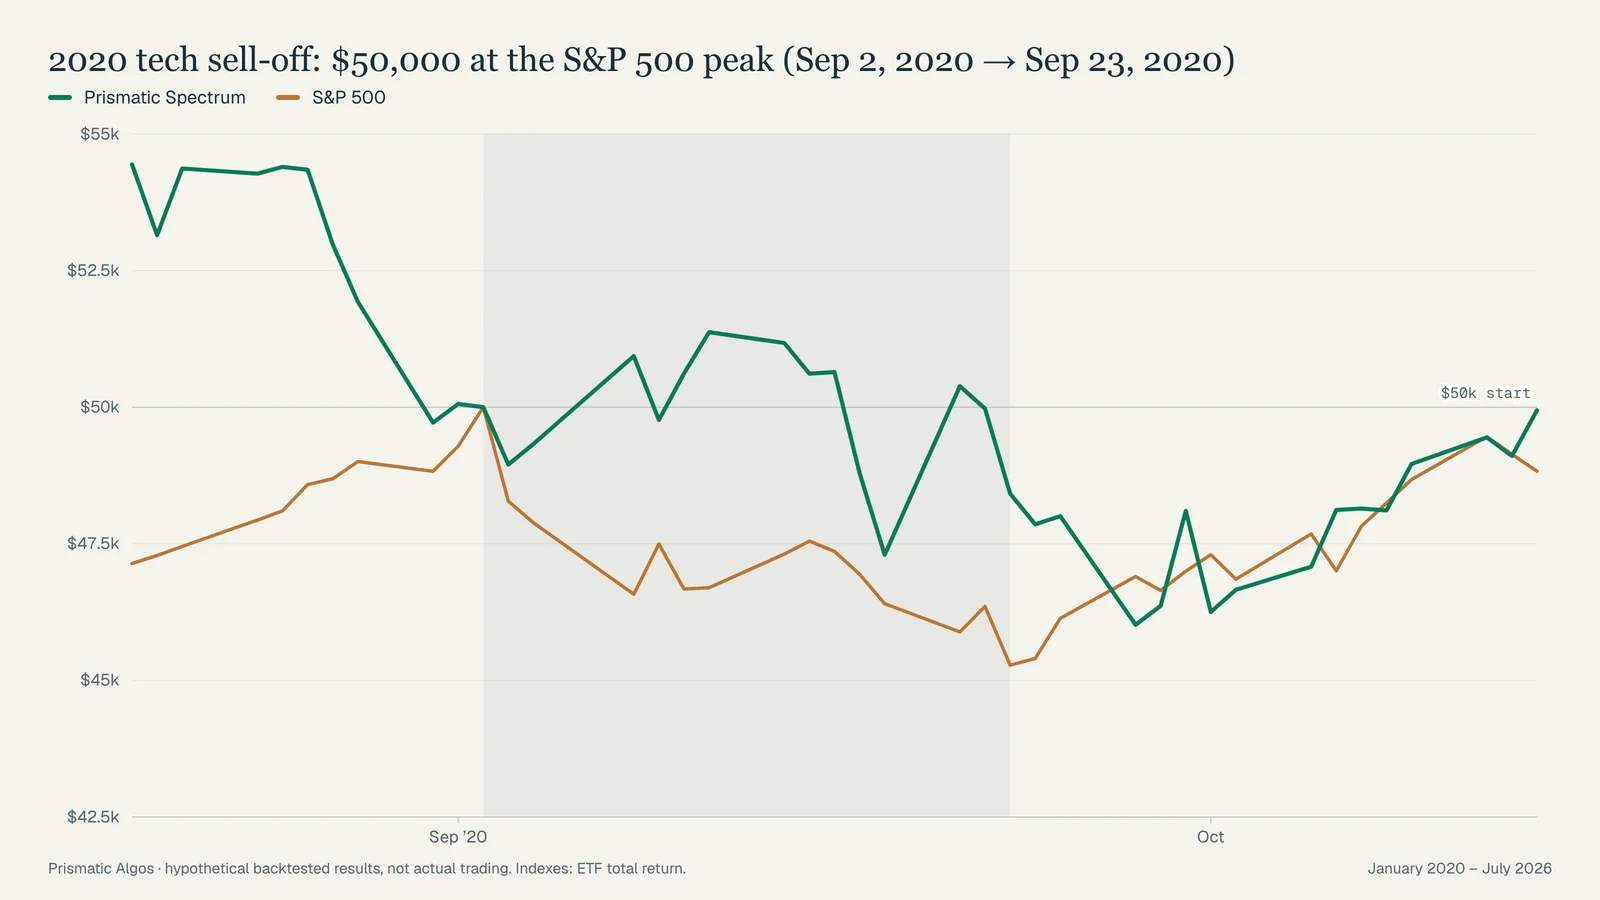
Indexes. S&P 500, Dow Jones and Nasdaq-100 are represented by the SPY, DIA and QQQ exchange-traded funds with dividends reinvested (adjusted closes, Yahoo Finance), which include each fund’s expense ratio. Sharpe ratios use the 3-month U.S. Treasury bill rate (FRED DTB3). Market-decline dates are the S&P 500 ETF’s closing peak and trough.
Risk. Trading foreign exchange, gold and index CFDs on margin carries a high level of risk and may not be suitable for all investors. Leverage can work against you as well as for you, and losses can exceed deposits. Past performance, whether actual or simulated, is not indicative of future results. This material is for information only and is not an offer or solicitation to buy or sell any security, fund interest or advisory service.