Give two trading algo designers the same price chart and they can reach opposite conclusions.
One sees a move worth following. The other sees a move that has gone too far.
That disagreement is the starting point for trend following and mean reversion. Trend-following rules seek to participate in a continuing move; mean-reversion rules seek a return toward a reference level. It would be reasonable to expect the two approaches to gravitate toward distinctly different markets.
Our latest research summary suggests a less tidy picture.
Prismatic Lattice, our growing research catalog at Prismatic Algos, now contains 6,572 indexed trading-strategy records. Within that collection, 2,008 are classified as trend following and 1,585 as mean reversion. Looking at the records that name an instrument, the two families keep returning to familiar territory.
EURUSD is the most frequently named instrument in both. Gold has a stronger presence in the trend-following subset, while EURUSD and GBPUSD have a stronger presence in mean reversion. But the overlap is at least as revealing as the differences.
These are patterns in how algorithms are described and classified. They are not rankings of trading performance.
First, the currency pairs
Among the three currency pairs with percentages supplied in this research summary, the ordering is identical in both families: EURUSD first, GBPUSD second and USDJPY third.
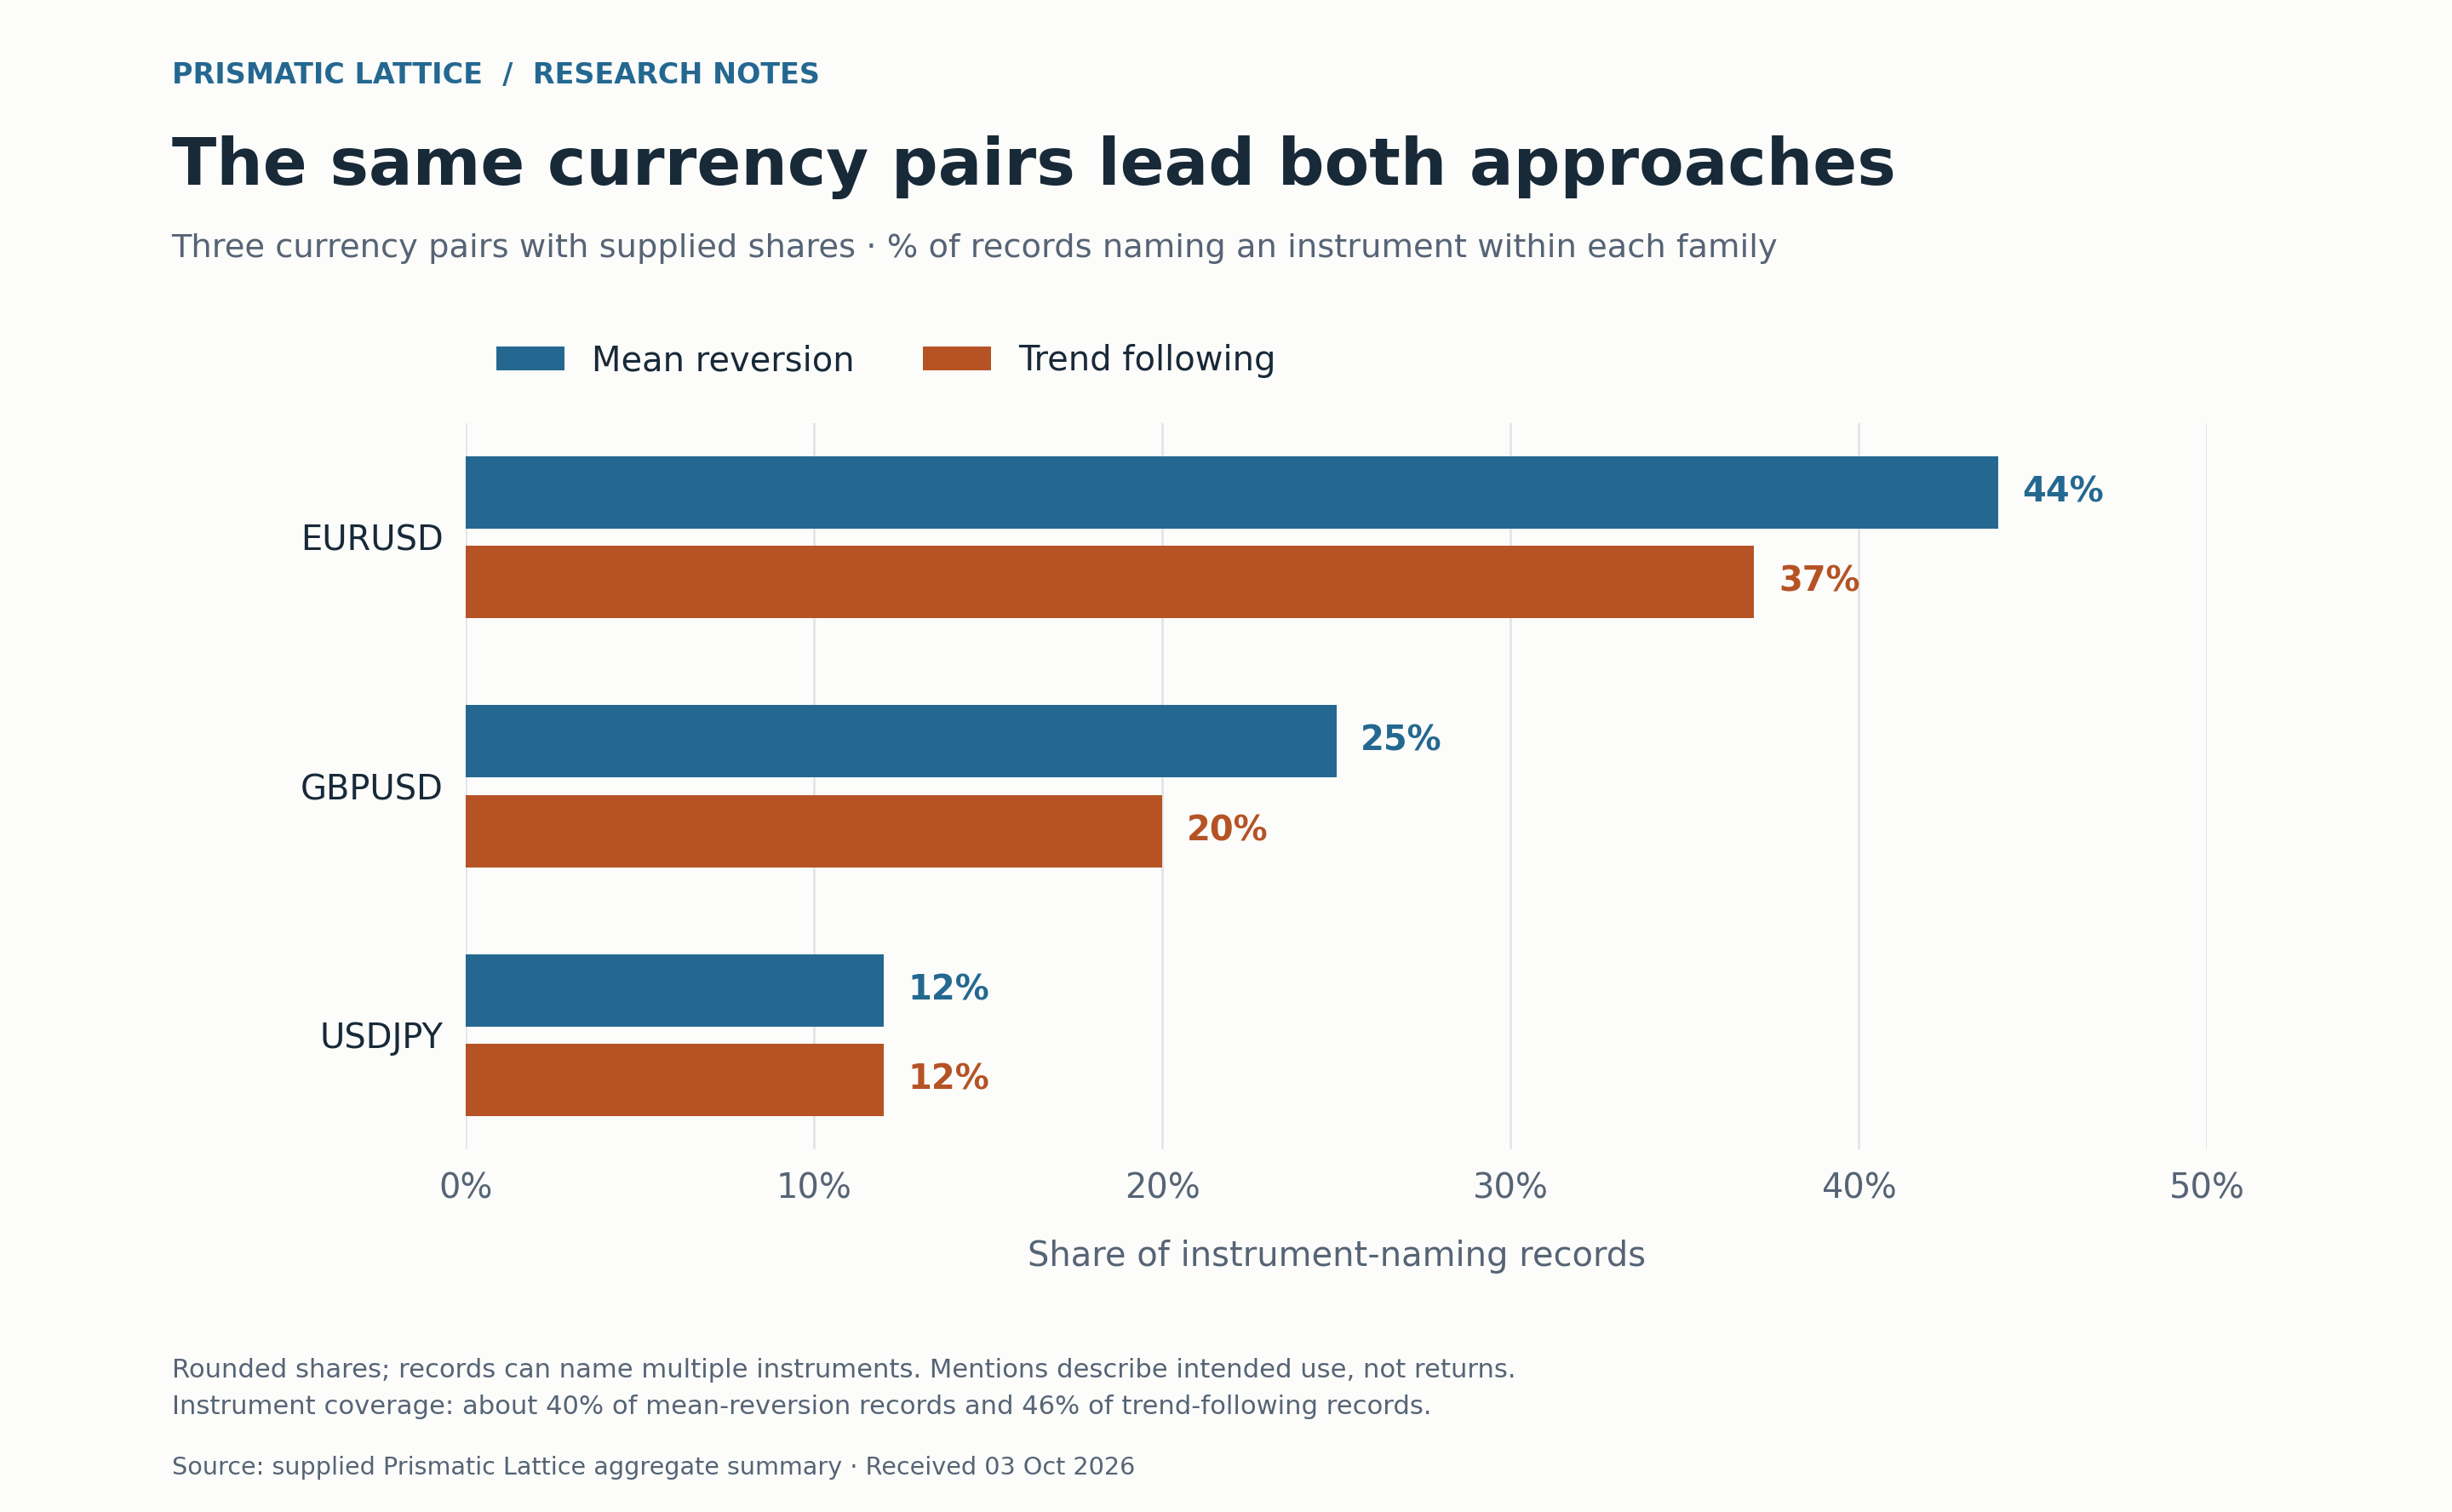
Figure 1. Each percentage is relative to the records within that strategy family that name at least one instrument. Values are rounded. The chart covers the three currency pairs with supplied percentages, not a complete ranking of all currency pairs.
EURUSD appears in 44% of the mean-reversion records that specify an instrument, compared with 37% of the comparable trend-following records. GBPUSD follows at 25% and 20%. USDJPY is level at the displayed precision: 12% in each.
The distinction matters. EURUSD is more prevalent within the mean-reversion subset, but that does not establish that more EURUSD strategies exist in that family in absolute numbers. The two families have different sizes and different rates of instrument disclosure.
Nor does it tell us that EURUSD is intrinsically a mean-reverting market. It tells us that authors in this collection frequently choose it when describing a mean-reversion idea—and frequently choose it for trend following, too.
Add gold, and the picture changes
The wider comparison includes gold, quoted as XAUUSD, and the German equity-index symbol DE40. Neither is a currency pair, so this is an instrument comparison.
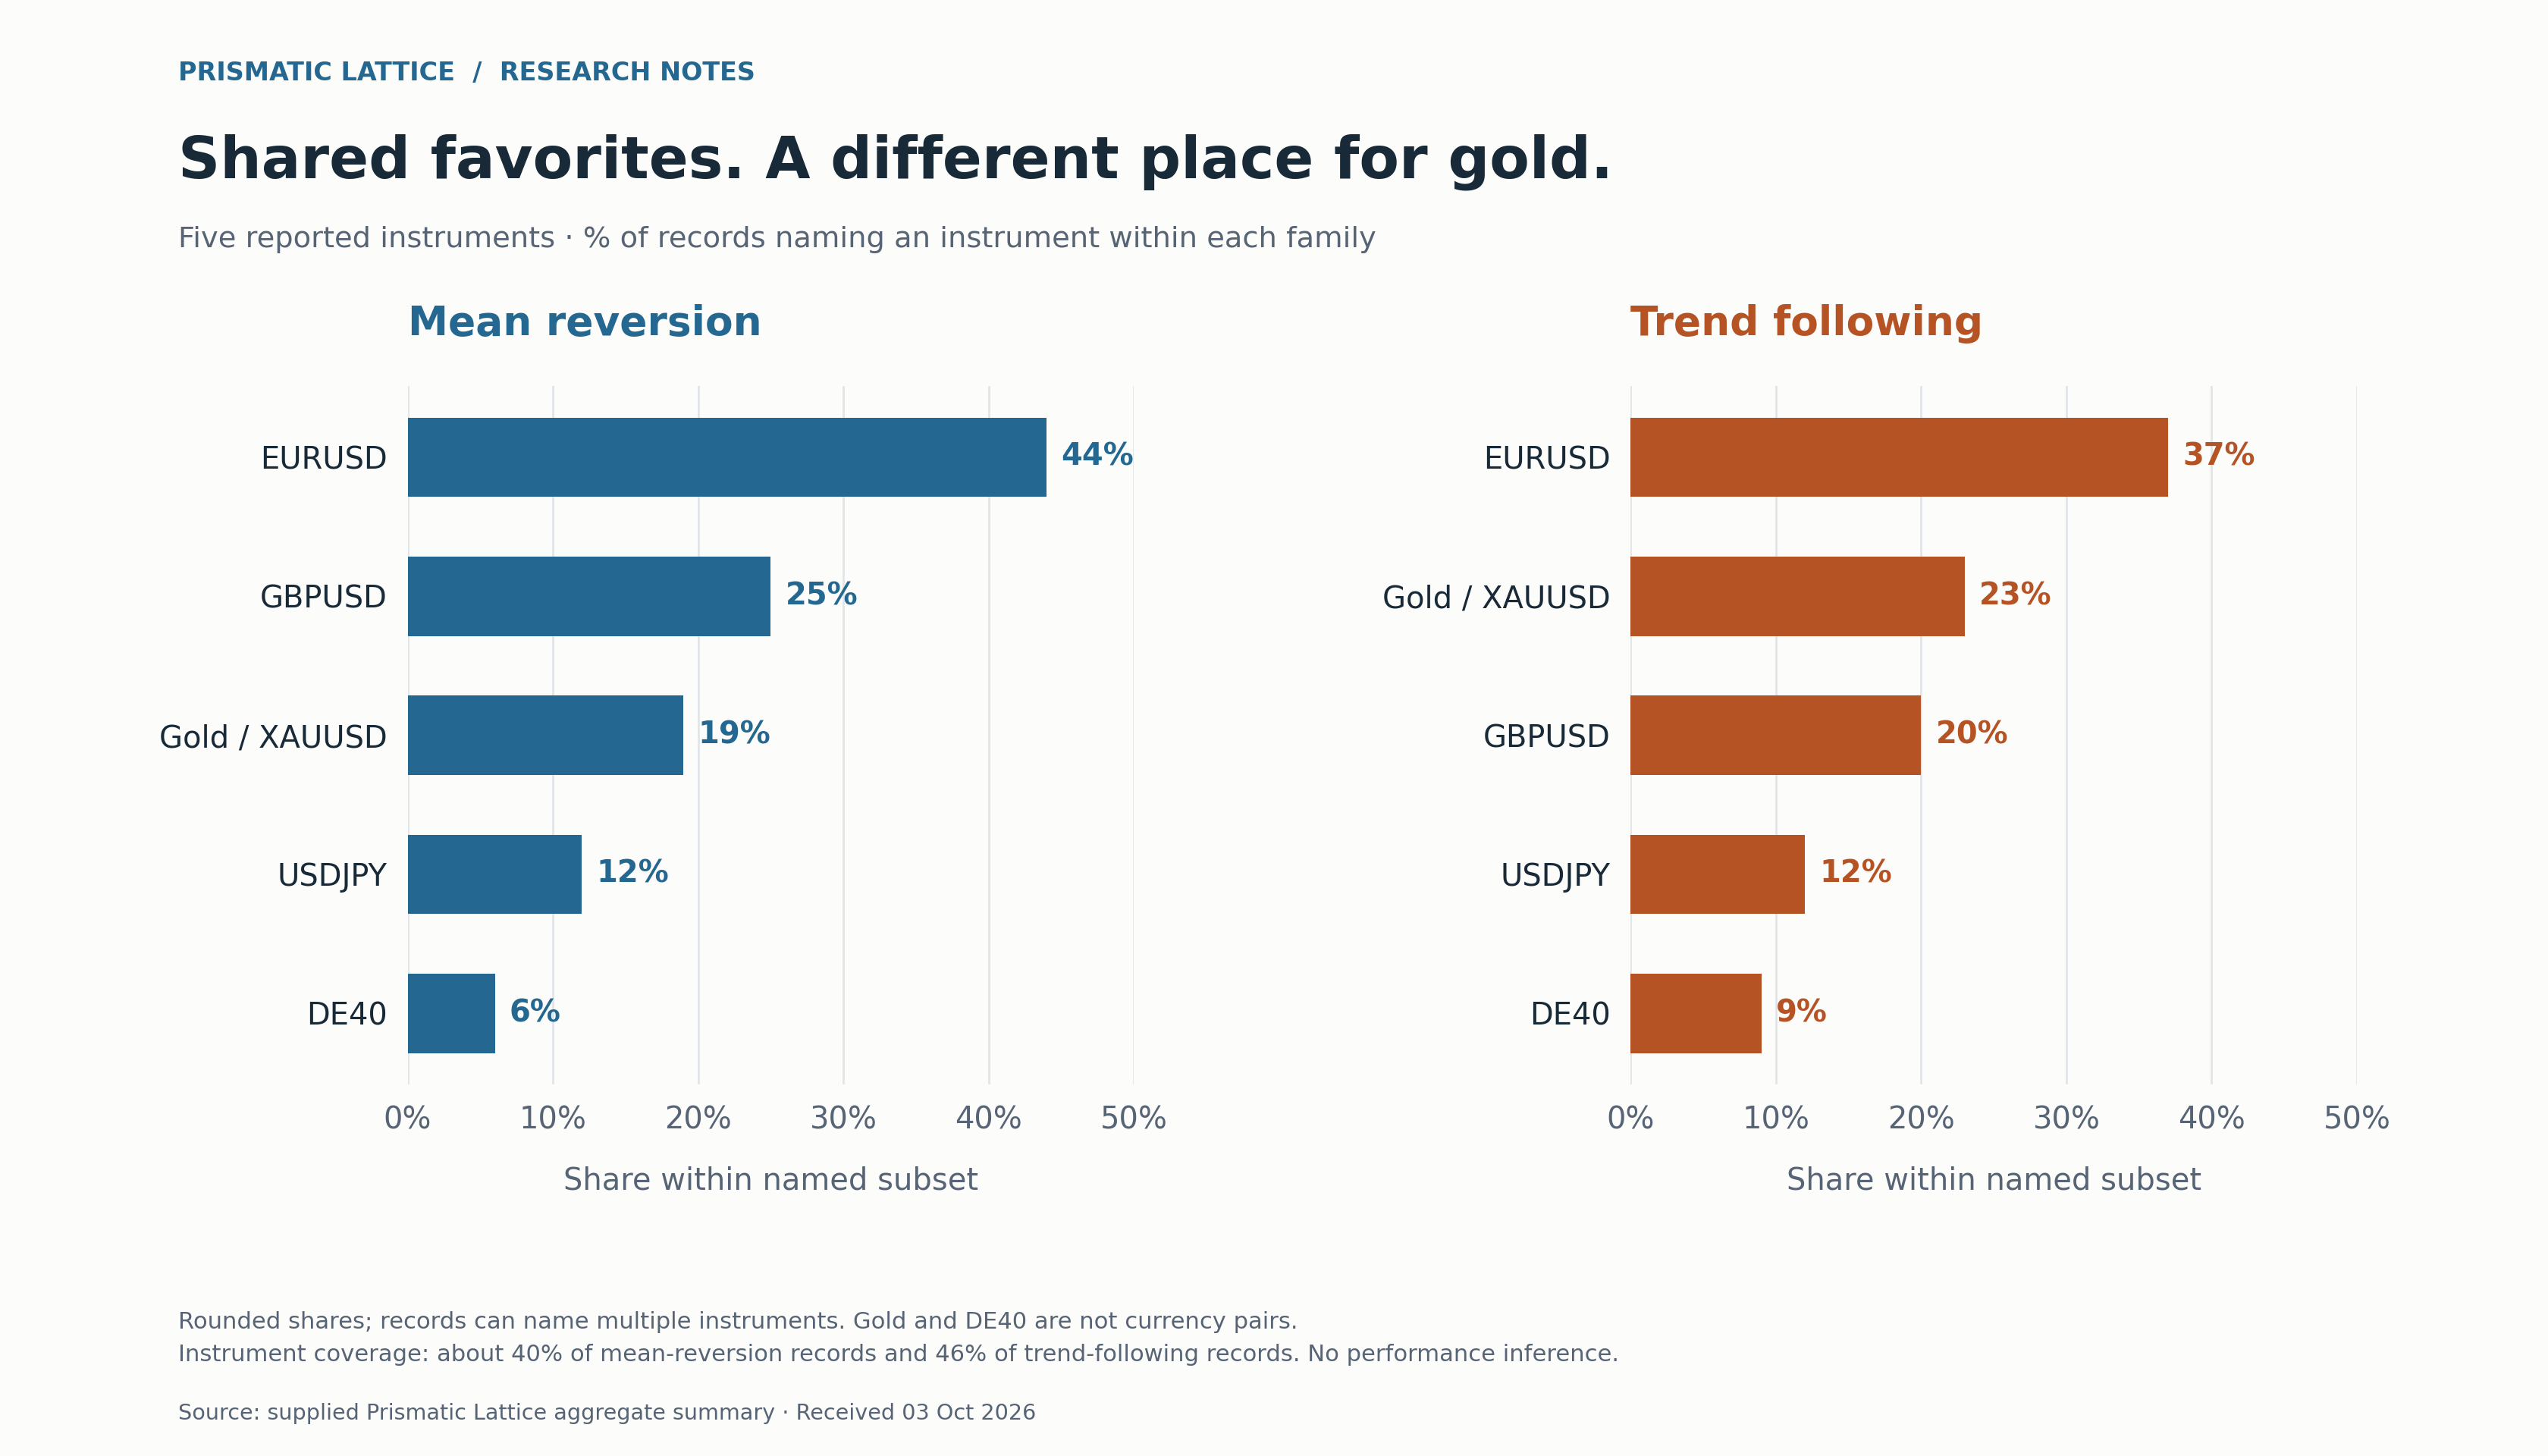
Figure 2. Rankings among the five instruments reported in the supplied table. Each panel uses its own family’s instrument-naming subset as the denominator; both panels use the same horizontal scale.
Gold moves ahead of GBPUSD in the trend-following panel: 23% versus 20%. In the mean-reversion panel, GBPUSD leads gold by 25% to 19%.
DE40 also has a greater presence within trend following, at 9%, compared with 6% for mean reversion. USDJPY occupies the same position in both panels.
| Instrument | Mean reversion | Trend following |
|---|---|---|
| EURUSD | 44% | 37% |
| GBPUSD | 25% | 20% |
| Gold / XAUUSD | 19% | 23% |
| USDJPY | 12% | 12% |
| DE40 | 6% | 9% |
Percentages describe mentions within each family’s instrument-naming records. They are not allocation weights or shares of trading capital. Instrument mentions are not mutually exclusive, so the columns need not total 100%.
One possible explanation is that researchers bring familiar expectations to familiar instruments: they look for reversals in one market and continuation in another. Another is that the collection reflects which examples, templates and source material are most available.
Those are hypotheses. This summary cannot separate them. We have a map of documented choices, not an explanation of why each author made them.
The missing half of the picture
There is a limit that belongs beside every chart in this story: most records in both families do not name an instrument.
Only about 40% of mean-reversion entries and 46% of trend-following entries specify one.
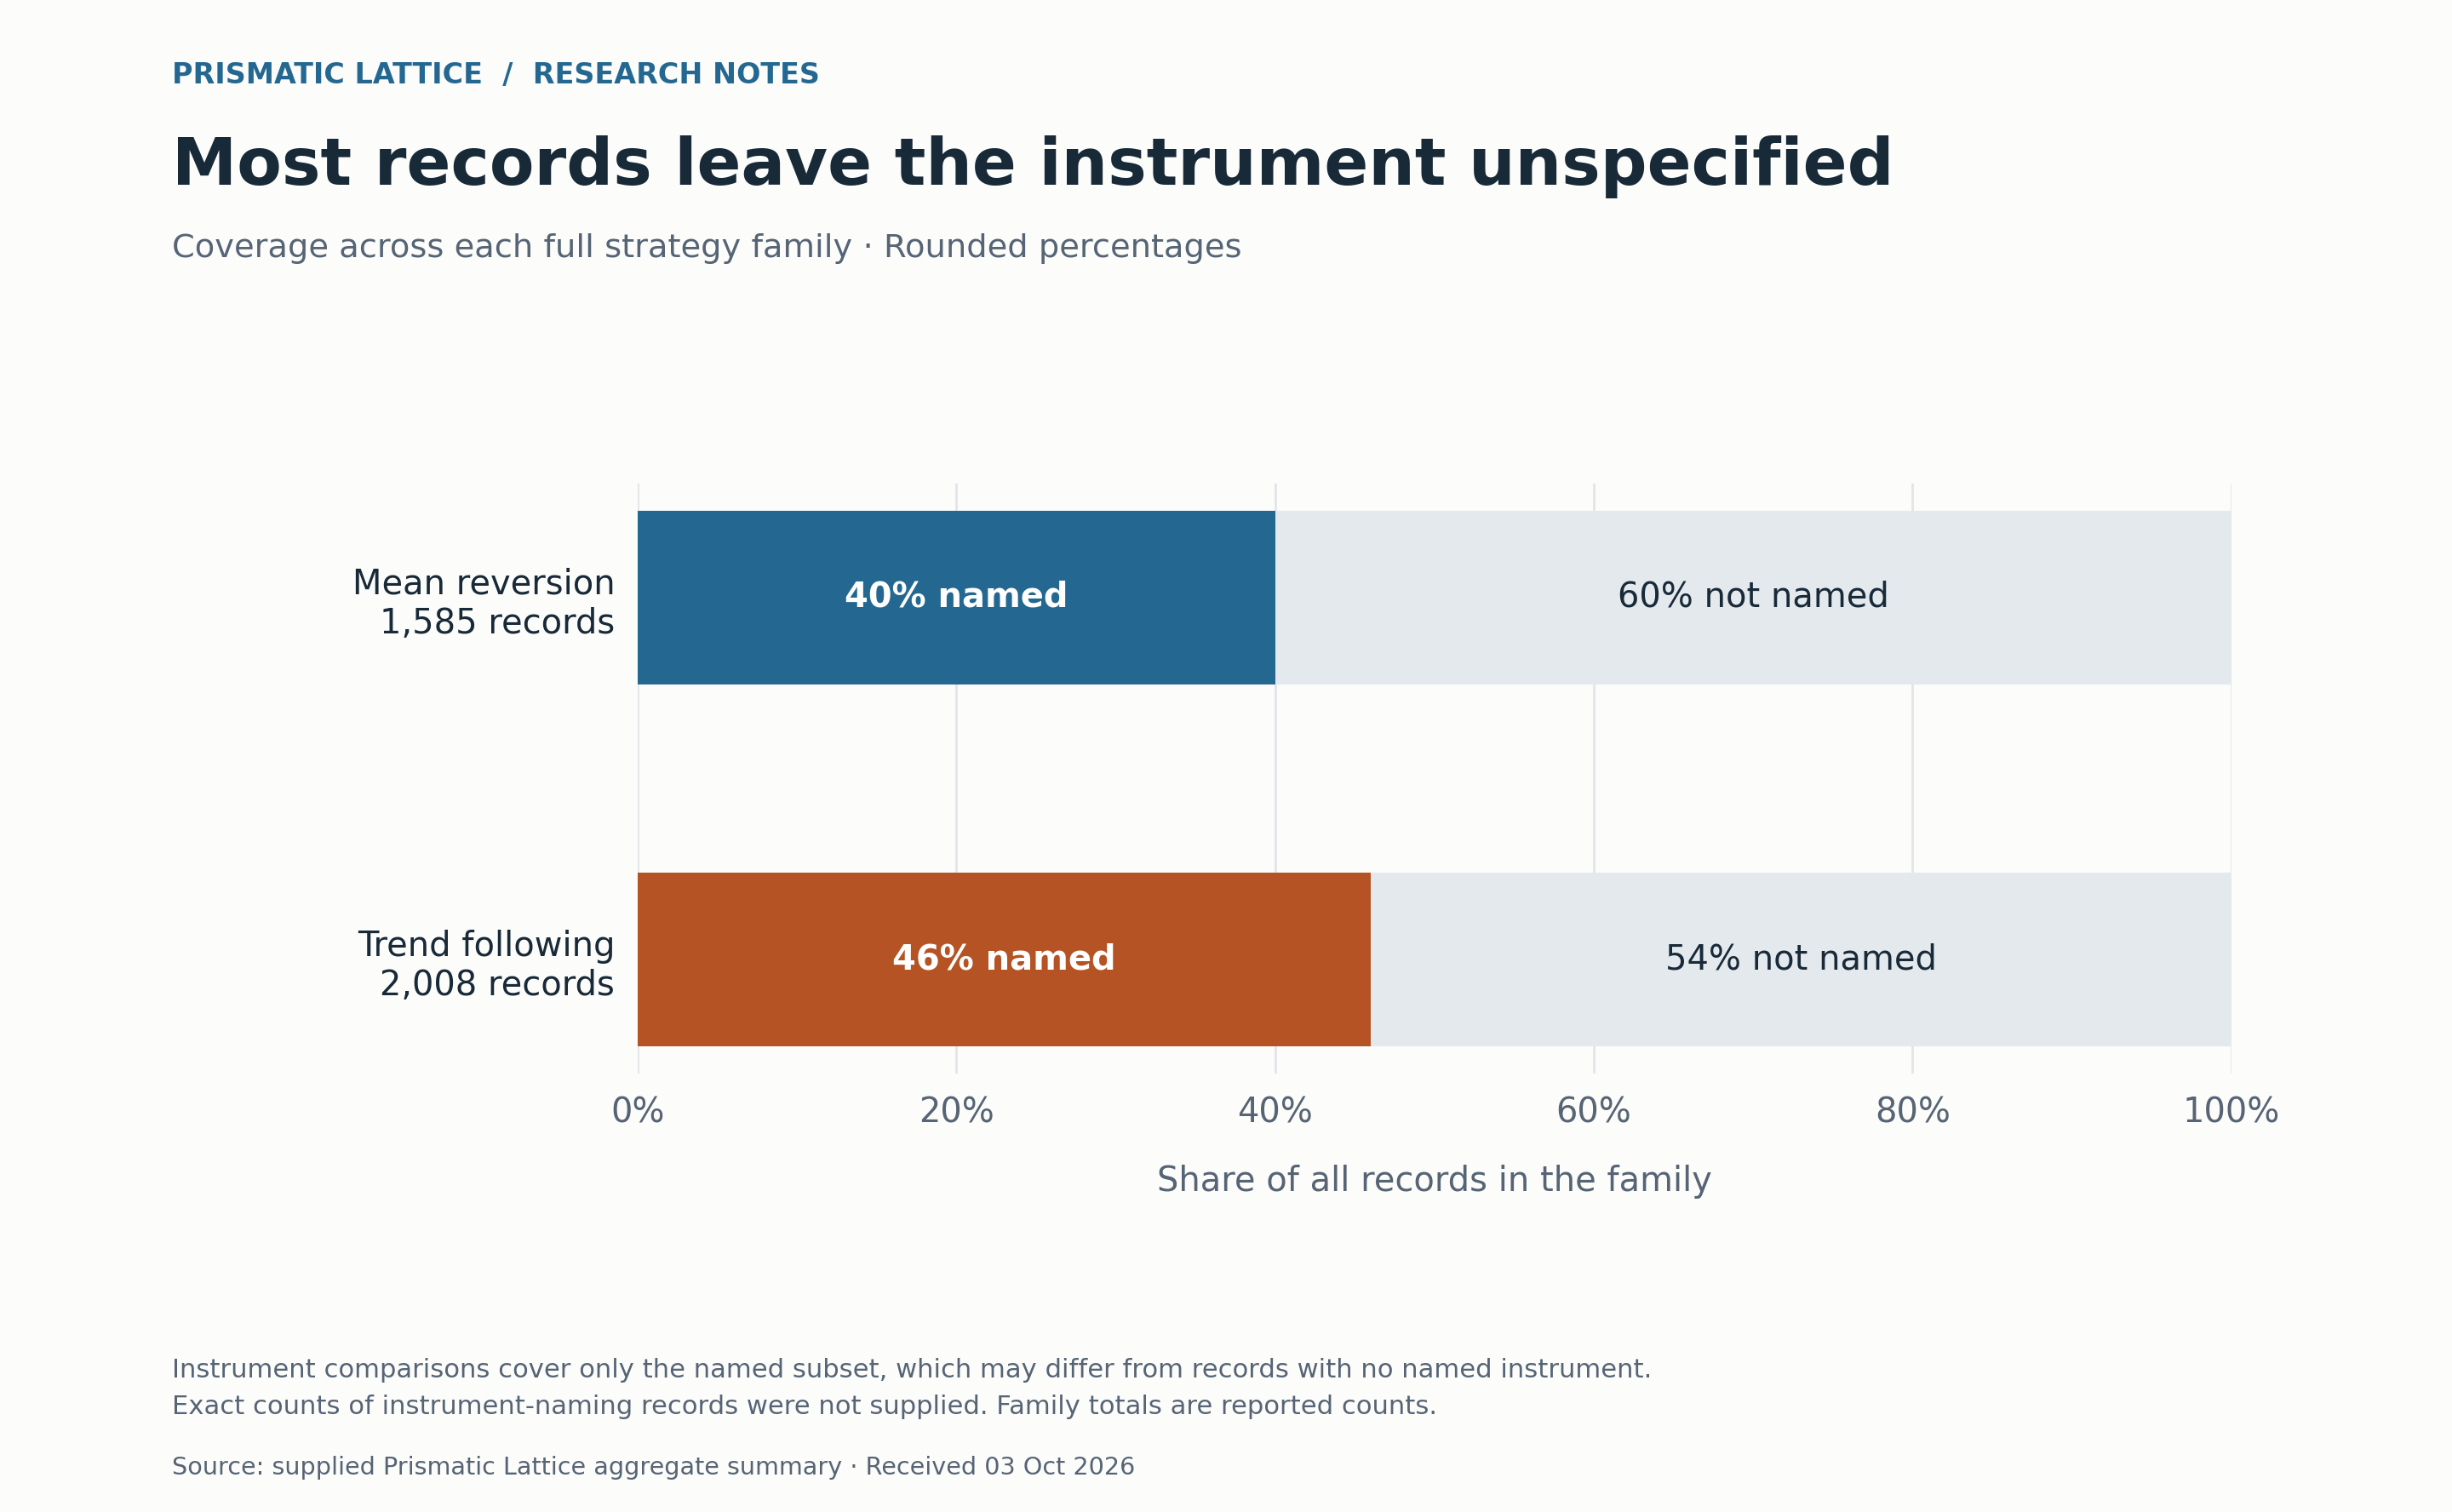
Figure 3. Rounded coverage rates across each full family: 1,585 mean-reversion records and 2,008 trend-following records. Exact counts of instrument-naming records were not supplied.
That makes the instrument analysis a view of the documented subset. The missing records might describe general methods, omit implementation details or differ in other ways. We cannot assume their instrument preferences match those of the records we can see.
The size of the full catalog does not remove that limitation. A collection of 6,572 records can still leave a particular question only partly answered.
What a trader can take from this
The findings offer a useful starting point for research questions.
If EURUSD attracts both styles, how much do their actual implementations overlap? Do they trade at different times, use different holding periods or define a move differently? Does the apparent disagreement disappear once the rules are written down?
If gold appears more frequently within trend following, does that preference survive testing on data that was not used to select the rules, with trading costs included? The catalog provides a reason to investigate. It does not provide the test result.
And if someone combines a trend-following algo with a mean-reversion algo on the same instrument, the two labels alone do not establish diversification. That would require evidence about their positions, returns and losses together. None of those outcomes can be read from an instrument-frequency chart.
The most revealing result here may be the shared favorite. Two opposing trading ideas keep coming back to EURUSD. The market name is the beginning of the story; the rules, timeframe and evidence have to supply the rest.
When you choose an instrument for an algo, what comes first: a measured behavior in the data, or a market you already know well?
Research note. This article uses the Prismatic Lattice aggregate summary supplied on October 3, 2026: 6,572 indexed records, including 2,008 classified as trend following and 1,585 as mean reversion. Instrument percentages are reported among entries naming an instrument within each family, following the supplied summary’s description. Percentages are rounded; exact instrument counts, the underlying row export, sampling frame and current deduplication audit were not supplied for this article. The collection is not a representative census of all trading algorithms, and indexed records need not be unique, independently validated systems. No statistical significance or profitability claim is made. The chart data reproduce the supplied aggregate figures; they are not an independent reanalysis of the catalog.
About the research. I am the founder of Prismatic Algos, which maintains Prismatic Lattice. Our public research catalog page currently uses the earlier Compendium name and an older snapshot; it provides background rather than the underlying data for this update.
Chart data: instrument shares (CSV) · family totals (CSV). These files reproduce the supplied aggregates.