Suppose you are given two trading algos. Both use a moving-average crossover. One takes every qualifying signal. The other requires a second indicator to agree before it enters.
Would you put them in the same research bucket?
For a first pass, probably. For a serious comparison, you would want to know what the filter changes: which trades disappear, which remain and whether the difference survives testing.
That is the classification problem coming into focus as Prismatic Lattice, our trading-algorithm research catalog, grows to 6,572 indexed strategy records. A larger collection makes familiar categories easier to count. It also makes their limitations harder to ignore.
Two buckets hold a lot of weight
The latest supplied summary contains 1,585 records classified as mean reversion and 2,008 as trend following.
Within mean reversion, 1,183 records—74.6%—sit in an oscillator overbought/oversold category. Within trend following, 842 records—41.9%—sit in a moving-average crossover category.
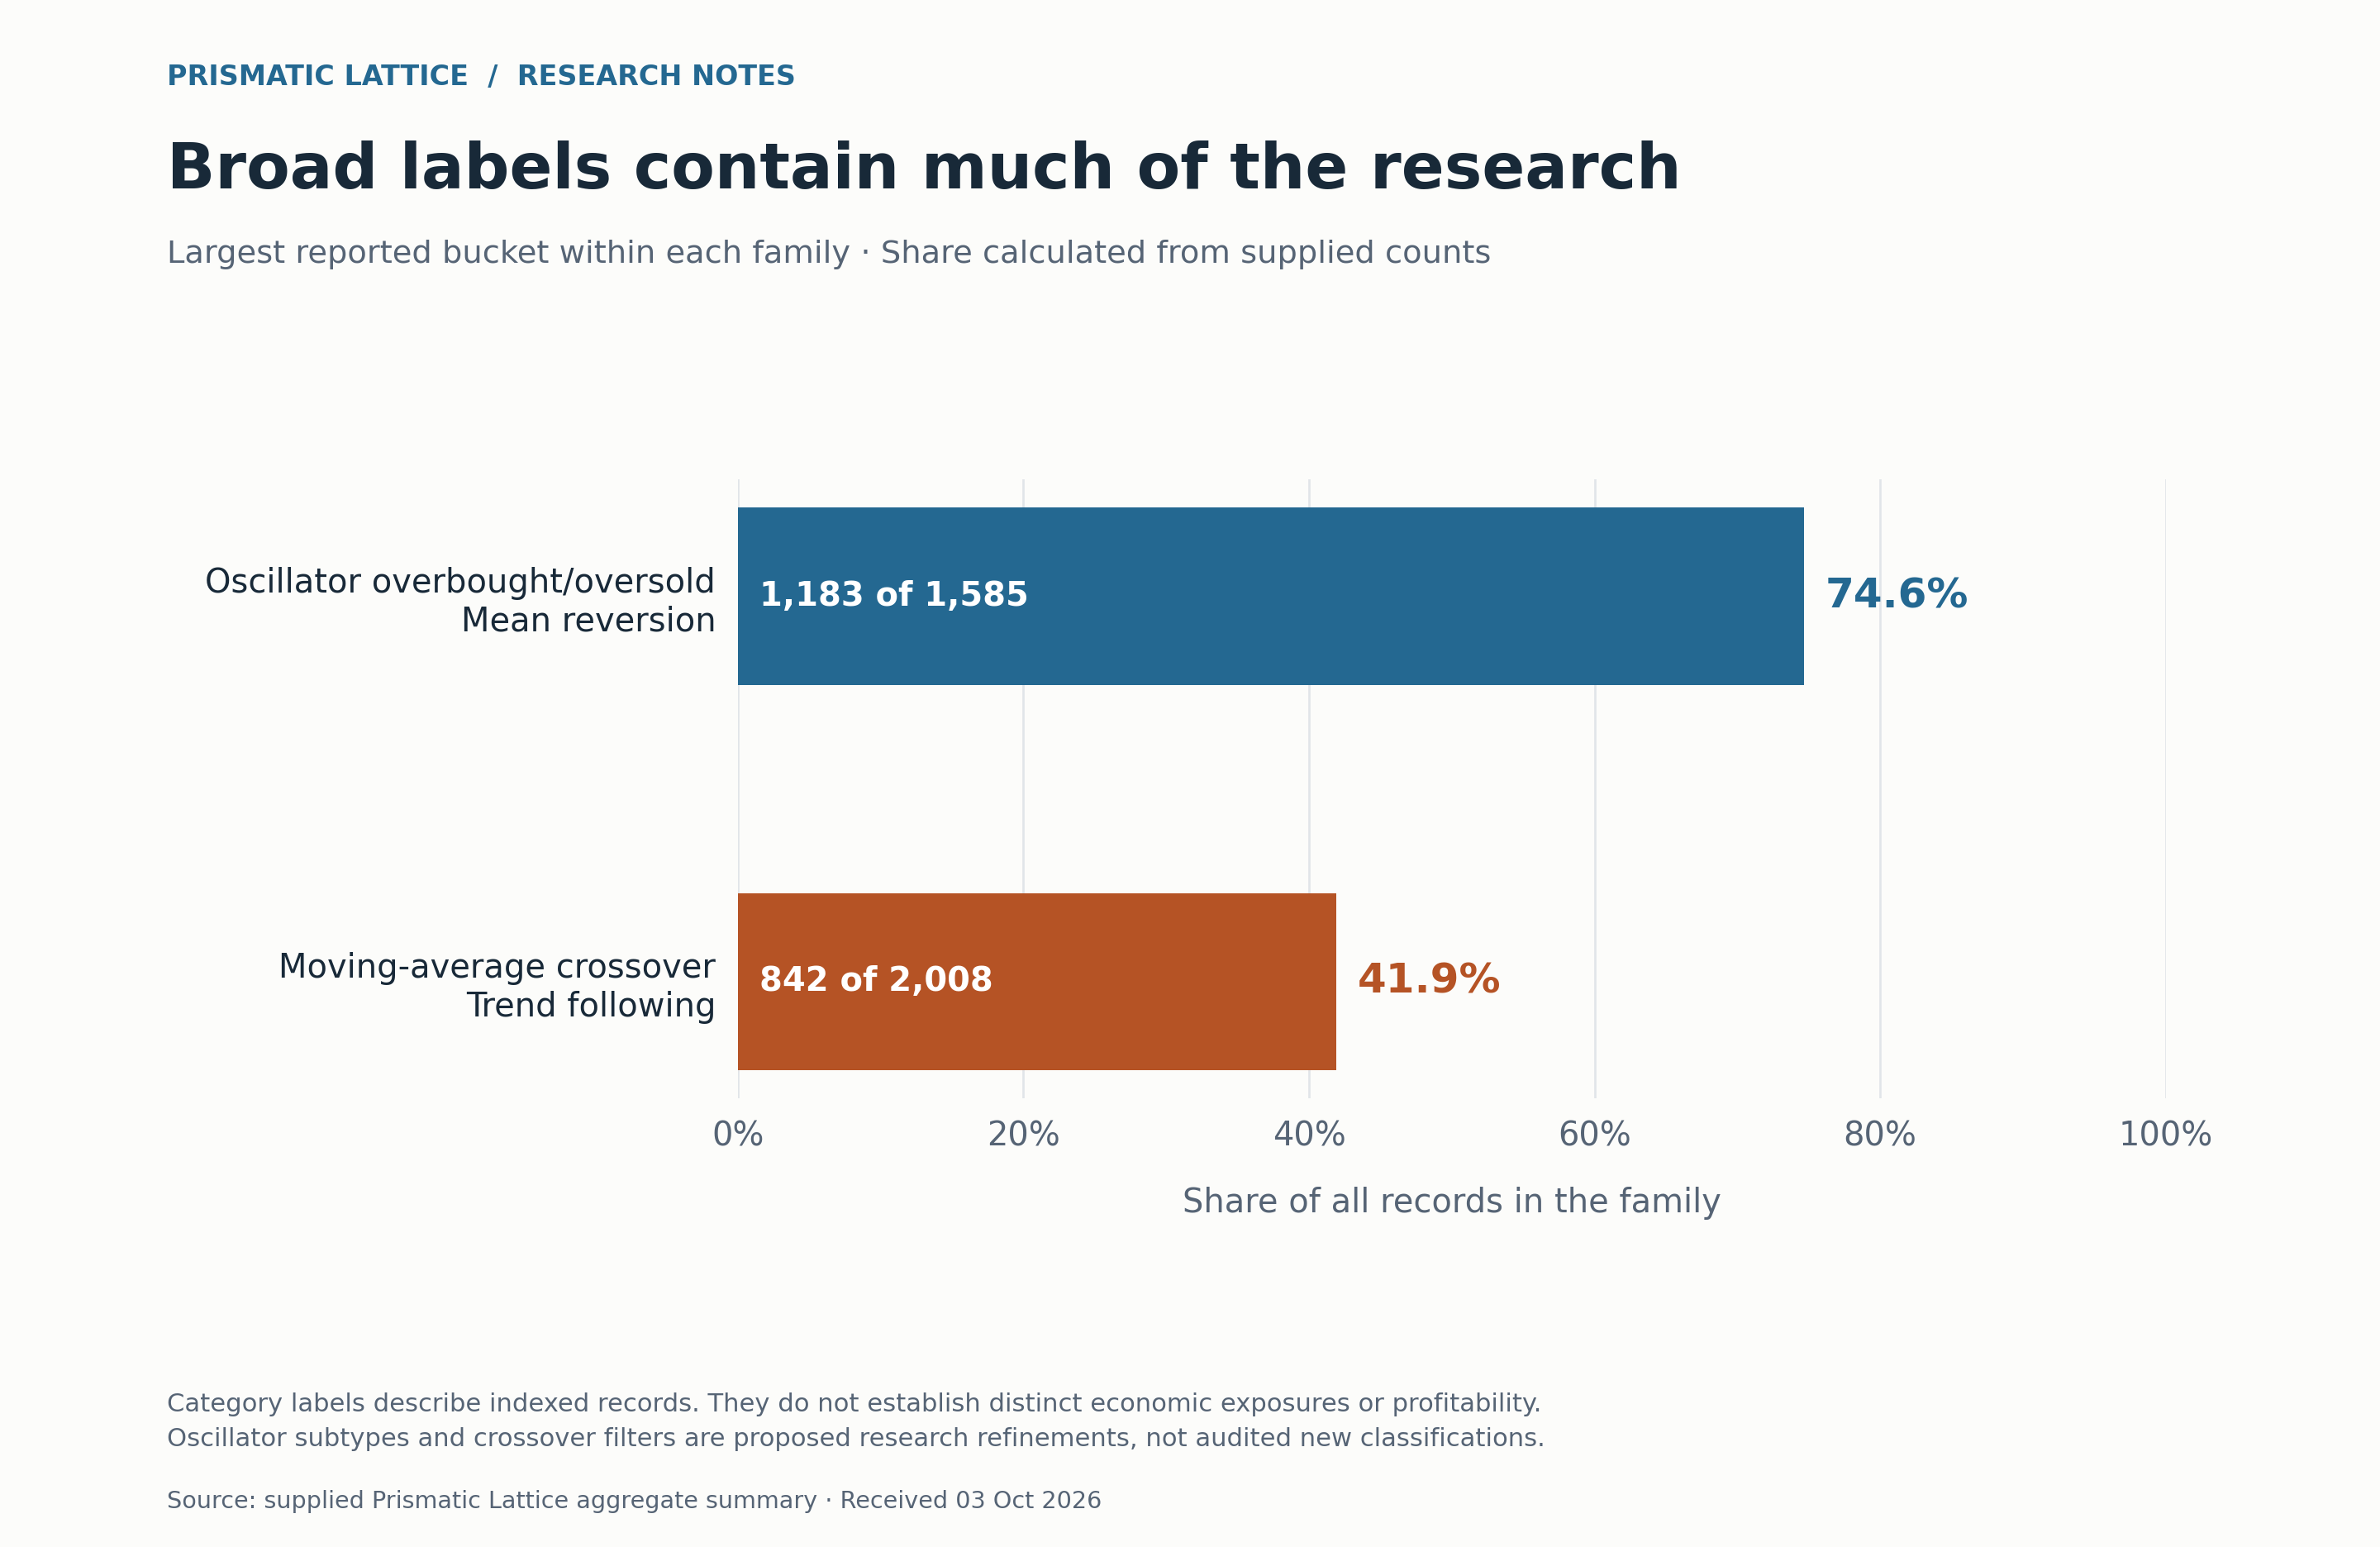
Figure 1. Shares calculated directly from the supplied category counts. These are classifications of indexed records, not performance results or measured economic exposures.
Those categories are useful signposts. They tell a researcher roughly where to look. But when nearly three-quarters of a family lands in one bucket, the next question is what the label leaves out.
An oscillator reading can be an entry trigger, a filter or an exit condition. Its presence does not fully describe the trading decision. Likewise, the words “moving-average crossover” do not tell us what happens after a signal, how positions are sized or when a trade ends.
The catalog count describes the amount of material available to study. It does not measure how many distinct sources of return that material contains.
Mean reversion offers a natural next cut
The stored indicator information suggests a useful way to make the largest mean-reversion bucket more informative.
The supplied summary reports 579 RSI mentions, approximately 250 Stochastic mentions, 124 MACD mentions, 104 CCI mentions and 21 MFI mentions within the oscillator bucket. RSI alone is numerically equivalent to almost half of the bucket’s 1,183 entries.
That makes an oscillator-specific breakdown a reasonable next research step. It could let readers ask more focused questions than “How many mean-reversion algos do we have?”
But the indicator totals are not a finished partition. One record may mention more than one indicator, the Stochastic figure is approximate, and a mention does not establish the indicator’s role. Adding the displayed numbers together would not produce a defensible count of unique subtypes.
Before treating these as separate strategy groups, we would need a clear rule for overlap and a check of what each indicator actually does in the strategy.
Trend following needs a different question
For the moving-average crossover bucket, splitting exponential averages from simple averages would describe the ingredients. Another useful distinction would describe the decision: is the crossover sufficient to enter, or must something else confirm it?
Consider an illustrative pair of rules. The first enters whenever a faster average crosses above a slower one. The second uses the same cross but requires an additional trend-strength condition. They share a signal, yet the second rule may select a different set of trades.
That does not make either rule better. A filter could help, hurt or add complexity without a durable benefit. The point is that the distinction creates a testable question that the broad category obscures.
A useful research record would separate the primary signal from confirmation rules, exits, sizing and trading constraints. With those fields available, researchers could compare like with like—or identify exactly where two apparently similar algos differ.
Why the labels matter beyond the database
It is easy to mistake a long list for a broad opportunity set. Ten strategy names can look diverse on a screen while leaving unanswered questions about whether they trade the same conditions or take overlapping positions.
The reverse is also possible: two strategies with the same broad label may implement meaningfully different rules. The label alone settles neither question.
Better classification helps identify what needs to be compared. Evidence from actual tests is still needed to establish how the systems behave, and evidence about their joint behavior is needed before making portfolio claims.
For our research, the next useful improvement is therefore more detail inside the largest buckets. Growth gives us more material. Clearer definitions make that material easier to question.
If two algos use the same indicator, what would you need to see before treating them as different strategies?
Research note. Based on the aggregate Prismatic Lattice summary supplied on October 3, 2026. Category shares are calculated as 1,183 ÷ 1,585 and 842 ÷ 2,008. Indicator counts are supplied metadata summaries, not independently audited classifications; overlap and role assignment remain unresolved. The proposed subdivisions have not been treated as completed work. This article makes no claim about the returns, robustness or diversification of the indexed strategies.
About the research. I am the founder of Prismatic Algos, which maintains Prismatic Lattice. The public research catalog page currently retains the earlier Compendium name and an older snapshot. The figures in this article come from the newer supplied summary.
Chart data: instrument shares (CSV) · family totals (CSV). These files reproduce the supplied aggregates.